ENEnglish
 LTLietuviškai
 DEDeutsch
 FRFrançais
 RUРусский
 ESEspañol
 PLPolski
 ITItaliano
 UKУкраїнська
 CSČeština
 PTPortuguês
 JA日本語
 LVLatviešu valoda
 ETEesti
 HUMagyar
 IDBahasa Indonesia
 TRTürkçe
 HIहिन्दी
 ELΕλληνικά
 ARالعربية
 THไทย
 VITiếng Việt
 RORomână
 MSBahasa Melayu
 BNবাংলা
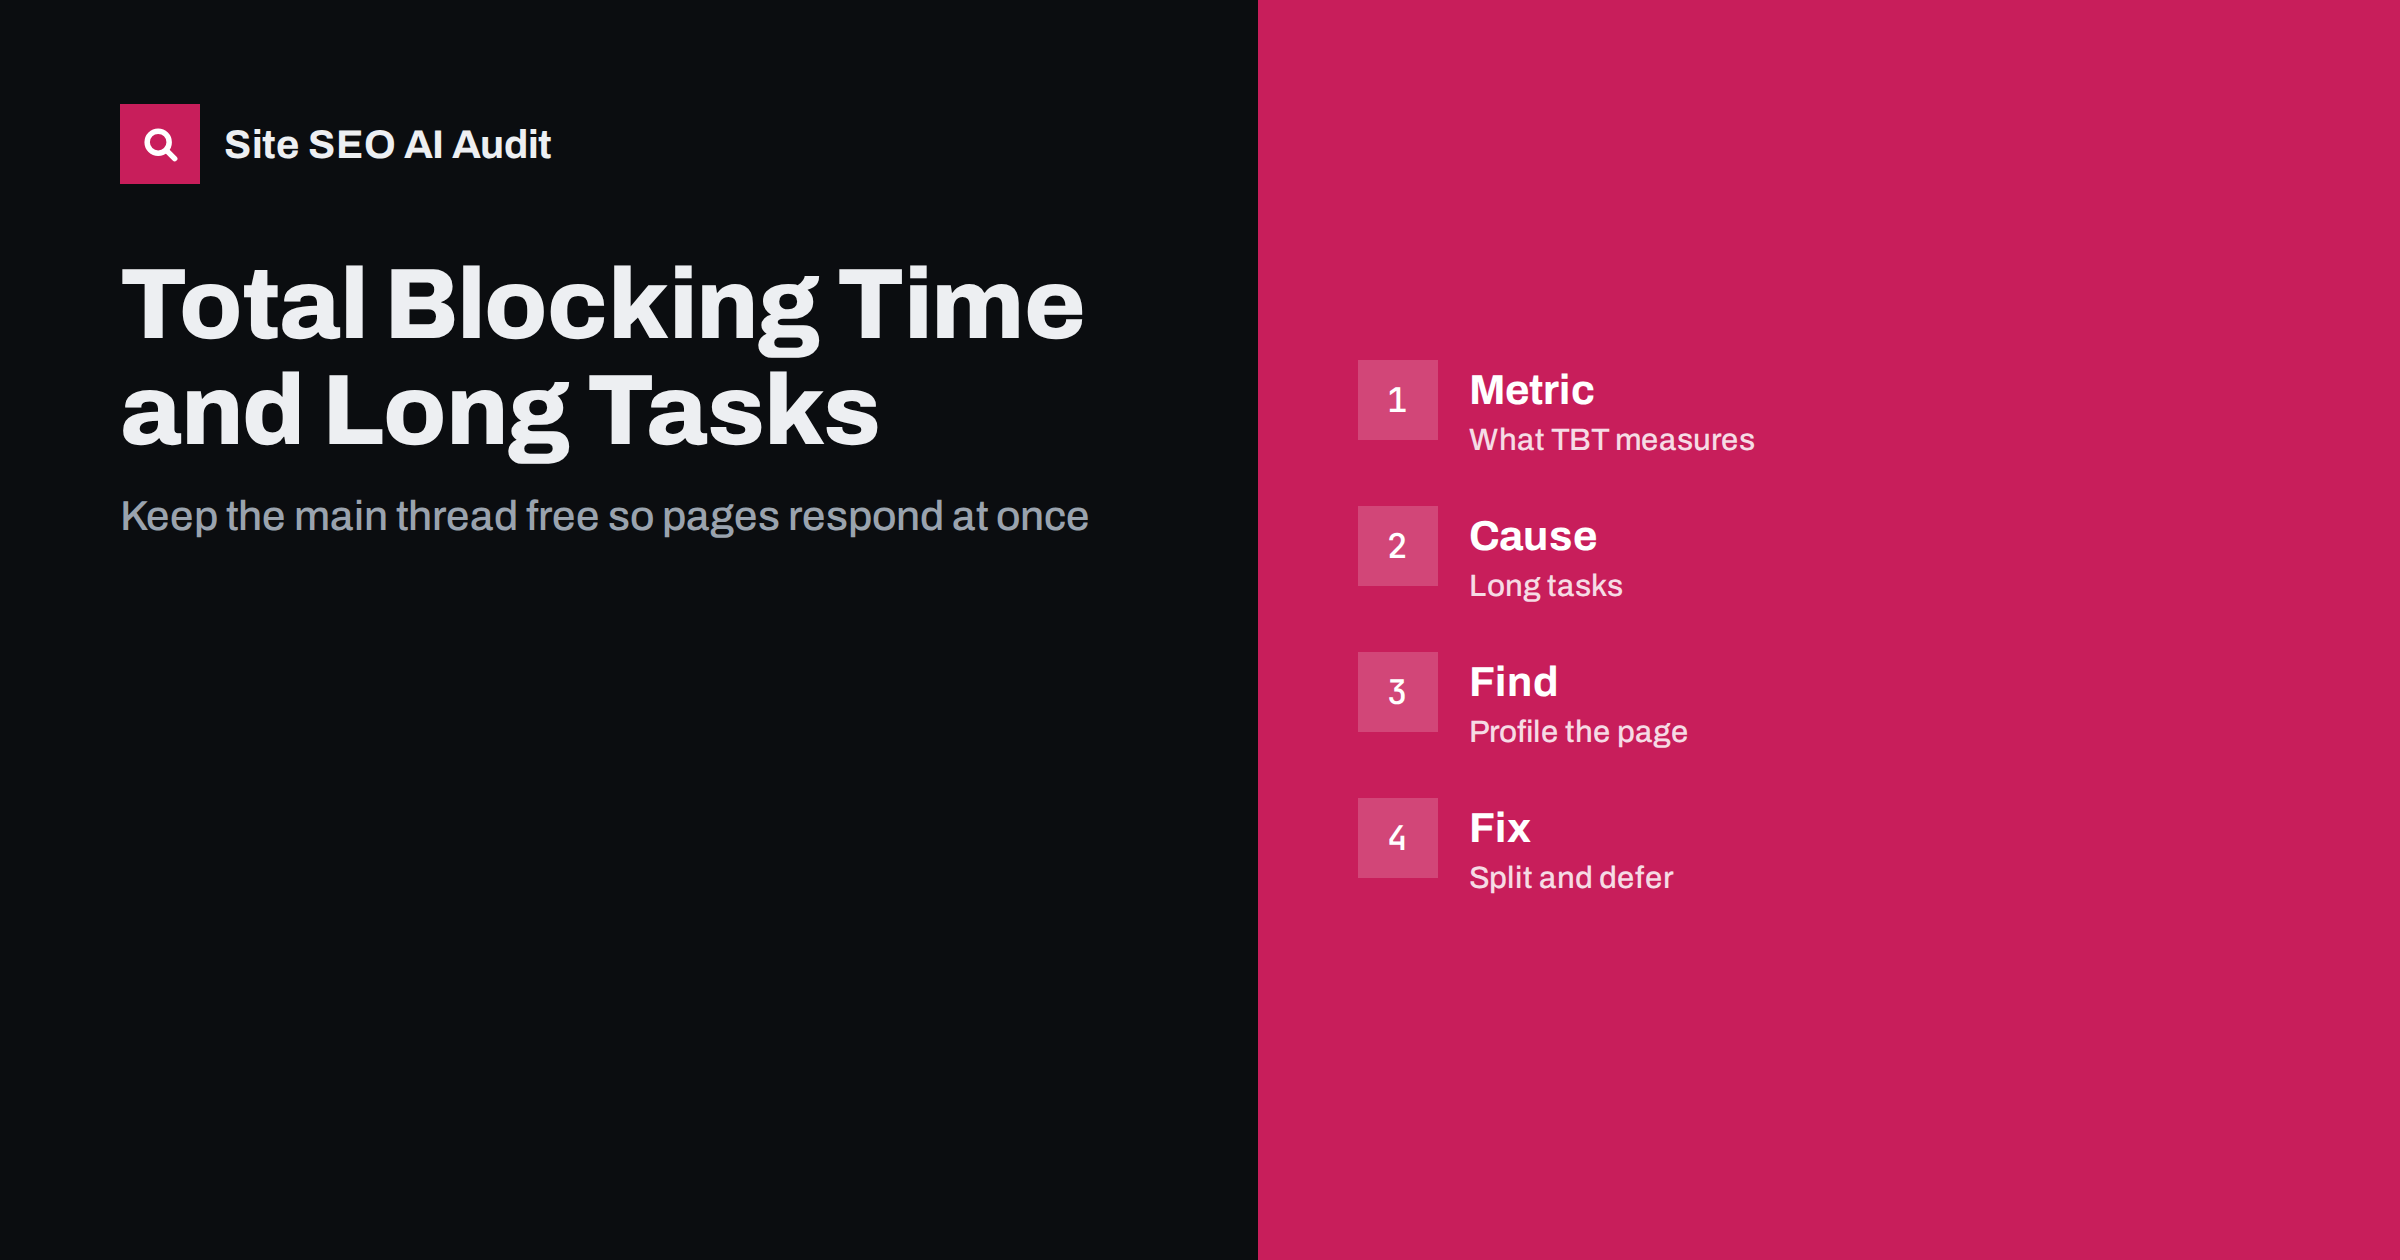
Short answer: Total Blocking Time (TBT) adds up the time that the browser’s main thread was blocked by tasks longer than 50 milliseconds between the first paint and the point where the page becomes interactive. It is a lab metric, so it is not a Core Web Vitals field metric, but it is a reliable warning that scripts are too heavy and that real visitors will probably see slow responses. Reduce it by shipping less JavaScript, splitting long tasks, deferring third-party code and measuring again.
Many pages look finished within a second but still feel stuck: a menu does not open, a button ignores the first tap, a form lags behind typing. The cause is usually the main thread, the single line of work in which the browser runs scripts, calculates layout and handles input. When a script occupies it for too long, nothing else can happen. TBT and long tasks are the vocabulary used to describe that problem. This guide explains both terms, shows how they connect to the metrics Google reports on real visits and lists practical ways to fix them. If you want the wider picture first, read the explanation of Core Web Vitals.
What the main thread does
A browser has many helpers, but most of the work on a page happens on one thread. It parses HTML, runs JavaScript, applies styles, calculates where things go and responds to clicks and taps. The thread can do only one job at a time. If a script runs for 400 milliseconds, a tap that arrives at millisecond 100 has to wait until the script finishes.
That waiting is what visitors experience as lag. It is also something search engines that render pages may run into when they process your content: heavy scripts can delay the point at which content appears in the rendered page, especially on slower devices.
What counts as a long task
A long task is any piece of work on the main thread that takes more than 50 milliseconds. The threshold is not arbitrary. Research on perception suggests that a response within about 100 milliseconds feels instant, and the browser needs part of that budget for its own work. Anything longer than 50 milliseconds risks pushing the response over the limit.
Long tasks come from large bundles that must be parsed and executed, heavy framework start-up, big loops over data, layout recalculation after many changes and third-party scripts such as tag managers, chat widgets and advertising code. A page can have dozens of them, and only some matter.
How Total Blocking Time is calculated
For each long task, TBT counts only the part above 50 milliseconds. A task of 120 milliseconds contributes 70, a task of 40 milliseconds contributes nothing and a task of 300 milliseconds contributes 250. The contributions are summed for the period between First Contentful Paint and Time to Interactive.
| Task length | Blocking part | Counted in TBT |
|---|---|---|
| 40 ms | 0 ms | 0 ms |
| 120 ms | 70 ms | 70 ms |
| 300 ms | 250 ms | 250 ms |
Because the metric sums many tasks, a page with many medium tasks can score worse than a page with one slightly longer task. Tools such as Lighthouse measure TBT on a simulated mid-range phone with a throttled connection, which is intentionally pessimistic.
TBT, INP and what Google measures
Google’s Core Web Vitals use field data from real visits. The responsiveness metric is Interaction to Next Paint (INP), which records how long the page takes to react to clicks, taps and key presses throughout a visit. TBT is a lab metric and does not appear in Search Console, but it correlates well with poor INP, because both are caused by a busy main thread.
Treat TBT as a development tool: it can be measured immediately after a code change, without waiting for field data to accumulate. Treat INP as the result that matters for visitors. The fixes are the same, and the guide on improving Interaction to Next Paint goes deeper into the interaction side.
Find the scripts that block
Do not guess; measure. Optimisation without a recording tends to remove the wrong thing and leave the real culprit in place.
Start with a lab test in Lighthouse or PageSpeed Insights and note the TBT value and the list of main-thread work. Then open the Performance panel in your browser’s developer tools, record a page load and look for red-marked long tasks. The call tree shows which script file or function occupied the time.
Group what you find into three kinds. First-party code includes your theme, bundles and custom scripts. Plugins and libraries include sliders, form builders and analytics helpers. Third-party scripts include tag managers, ad networks, social widgets and chat tools. The last group is often the largest and the hardest to control, which is why the guide on third-party scripts and speed is worth reading before you decide what to keep.
Ship less JavaScript
The cheapest long task is the one that never runs. Remove plugins and libraries that no longer earn their place, load scripts only on the pages that use them, and replace heavy libraries with native browser features when the feature is simple. Check your bundle for duplicate packages and unused code, and use modern syntax so older compatibility code is not sent to every browser.
Compression and caching help the download, but they do not reduce parsing and execution. A bundle of 500 kilobytes compressed may expand to several megabytes of code that the phone has to process, so size on disk is only part of the story.
Frameworks deserve a separate check. Pages that build their content in the browser must download, parse and run the framework before anything useful appears, while pages rendered on the server send finished HTML and need less script to become usable. If your site relies on client-side rendering for ordinary content, consider server rendering or static generation for those templates, as discussed in the basics of JavaScript SEO. Also remember that every extra script has a cost on every visit, so a feature used by one visitor in a hundred should not slow down the other ninety-nine.
Split long tasks and defer the rest
When code must run, break it into smaller pieces so the browser can respond to input between them. Developers can yield to the main thread with timers, scheduler APIs or by moving non-urgent work to idle time. Heavy computation can move to a web worker, which runs in a separate thread.
For scripts you do not control, load them with the defer or async attributes, delay non-essential widgets until the visitor scrolls or interacts, and move tag manager triggers from page load to later events. Keep critical content, navigation and forms free of dependence on late scripts, so that the page works even if a widget loads slowly.
A worked example
Imagine a small shop whose product page scores a TBT of 780 milliseconds on the mobile test. The recording shows four heavy items: a theme bundle that takes 260 milliseconds to execute, a tag manager that launches five tags at load for 210 milliseconds, a chat widget with 150 milliseconds and a reviews slider with 120 milliseconds. Together they explain almost the whole figure.
The owner removes a second analytics tag that duplicates the first, delays the chat widget until the visitor scrolls, loads the slider script only on pages that contain a slider and splits the theme initialisation into two steps. The next test shows 310 milliseconds. Nothing visible was lost, and the work took an afternoon. The lesson is to attack the largest items first and to ask of each script whether the page would be worse without it. Write the change down in an SEO changelog so that later traffic changes can be explained.
Repeat the exercise for each important template, such as the home page, a category, a product or article page and the checkout, because each loads a different mix of scripts. A problem on a template used by thousands of URLs matters far more than one on a rarely visited page.
Measure again and set a budget
After each change, run the same test several times, because lab results vary. Record the TBT before and after, and check real-user INP after a few weeks. Set a budget for script size and TBT for important templates and fail a build when the budget is exceeded. A reminder in the release process is easier than a cleanup after a redesign. Regular crawls help too: Site SEO AI Audit includes speed checks in its seven areas, and the first audit of up to 200 pages is free.
Related reading
The bottom line
TBT shows how long scripts keep the page from responding; ship less code, split long tasks, defer third-party scripts and measure again.
الأسئلة الشائعة
Is Total Blocking Time a ranking factor?
Not directly. Google’s page experience signals use field metrics such as INP. TBT is a lab warning that often predicts poor responsiveness.
What is a good TBT score?
Lighthouse treats a TBT of up to 200 milliseconds as good and above 600 milliseconds as poor, on its simulated mobile test.
Why is my TBT high on mobile but low on desktop?
Mobile tests simulate a slower processor, so the same scripts take longer to run and produce more long tasks.
Can a cache plugin fix long tasks?
Not by itself. Caching speeds up delivery of HTML and files, but long tasks come from JavaScript execution in the browser.
Which scripts should I remove first?
Start with the largest main-thread consumers that bring the least value, which are often unused plugins, duplicate analytics tags and decorative widgets.