ENEnglish
 LTLietuviškai
 DEDeutsch
 FRFrançais
 RUРусский
 ESEspañol
 PLPolski
 ITItaliano
 UKУкраїнська
 CSČeština
 PTPortuguês
 JA日本語
JA日本語 LVLatviešu valoda
 ETEesti
 HUMagyar
 IDBahasa Indonesia
 TRTürkçe
 HIहिन्दी
 ELΕλληνικά
 ARالعربية
 THไทย
THไทย VITiếng Việt
 RORomână
 MSBahasa Melayu
 BNবাংলা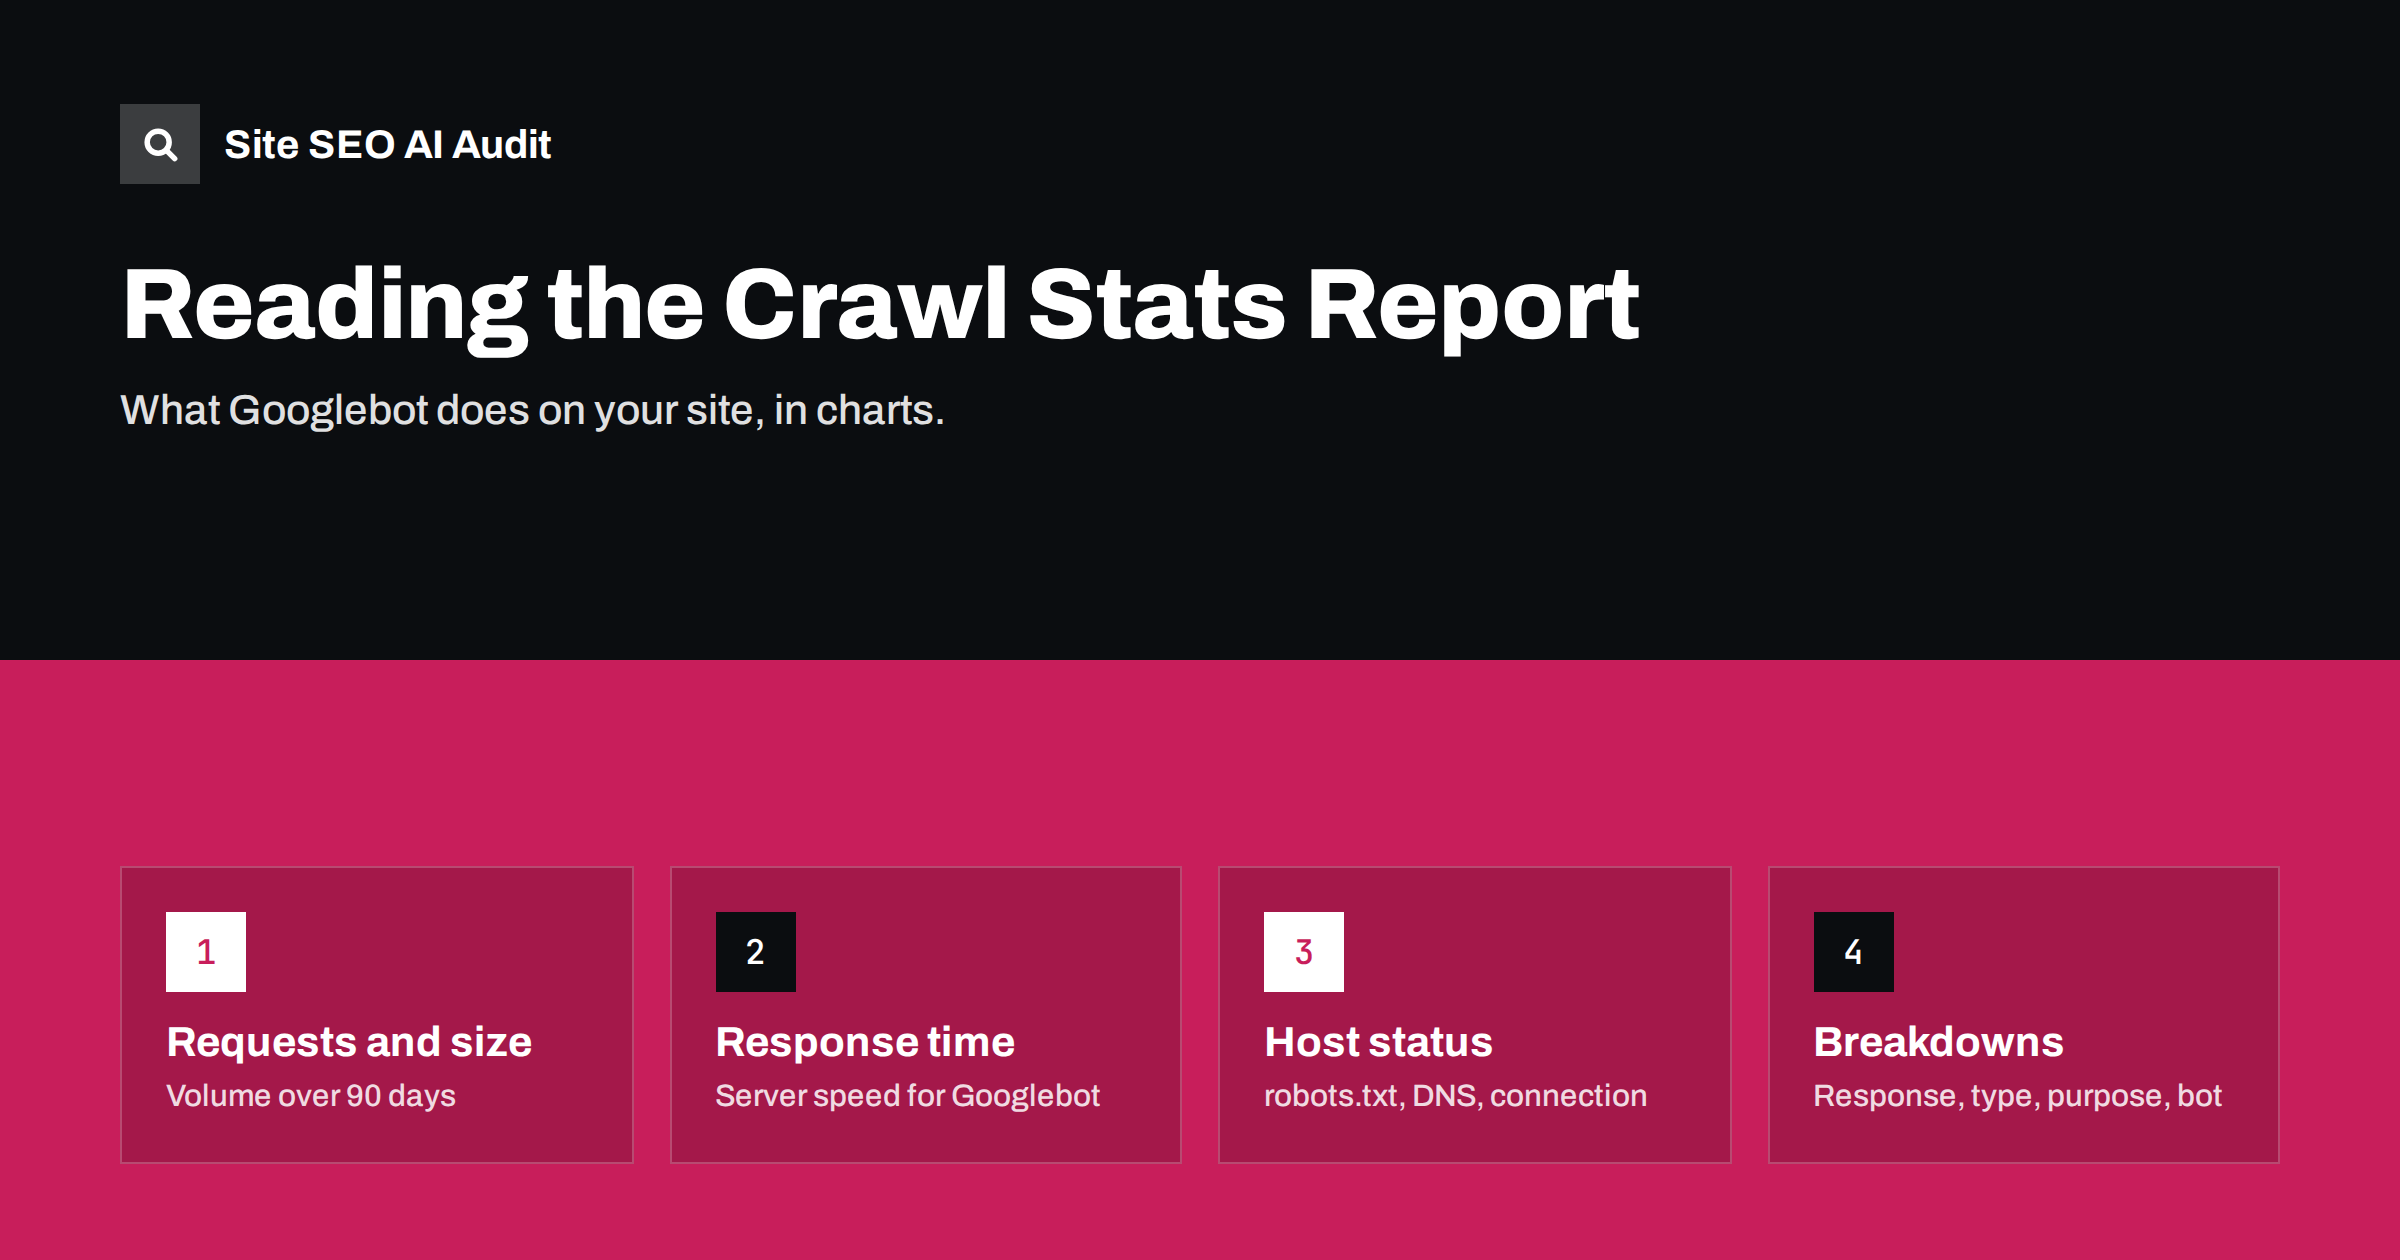
Short answer: the Crawl Stats report in Google Search Console shows how Googlebot has crawled your site over the last 90 days: how many requests it made, how much it downloaded, how fast your server answered, whether it had trouble reaching the host, and how requests break down by response code, file type, purpose and crawler type. Most sites only need to check it occasionally. It becomes important when new pages are slow to appear in search, when the server struggles, or after a migration.
Where to find the report and who it is for
The report is not in the main menu. Open Search Console, go to Settings, and click Open report next to Crawl stats. It is available for root-level properties, meaning a domain property or a URL-prefix property at the root of a host, not for a subfolder property such as https://example.com/blog/.
Google describes it as a report for advanced users, and that is fair. For a small site with a few hundred pages that are indexed without problems, the report is mostly reassurance. It earns its keep on larger sites, on sites with slow or unstable hosting, and during changes such as a redesign, a move to HTTPS or a platform migration. If you are unsure whether crawling is a concern for your site at all, our guide on when crawl budget matters is a good first stop.
The three main charts
At the top of the report is an over-time chart with three metrics you can toggle:
- Total crawl requests: every request Googlebot made to your host, including pages, images, scripts, stylesheets, robots.txt and redirects, whether successful or not.
- Total download size: the number of bytes downloaded during crawling. Resources that Google already has cached do not add to it.
- Average response time: how long, on average, your server took to return the content of a request, not including the time to render the page.
Read them together. A rise in requests with stable response time usually means Google found new or changed content, or started trusting your server with more load. A rise in response time followed by a fall in requests often means Googlebot slowed down because your server became slow. Our article on server response time and TTFB covers how to fix the underlying speed problem.
Host status: can Google reach your site?
The host status panel summarises availability problems in the last 90 days across three checks:
- robots.txt fetching: whether Google could retrieve your robots.txt file. If robots.txt returns a server error for a sustained period, Google may stop crawling the site until it can read the file again, to avoid crawling URLs you meant to block.
- DNS resolution: whether your domain name resolved to an IP address.
- Server connectivity: whether the server accepted connections and responded.
Each check shows a status such as no significant problems, problems in the past, or a recent problem. A past problem that has not repeated is usually an old incident, for example a short outage. Repeated or current problems deserve attention because they directly limit crawling. Note that a robots.txt file that returns 404 is fine: Google treats a missing file as permission to crawl everything. Our guide to robots.txt for SEO explains what the file should contain.
Breakdown by response code
Below the charts, crawl requests are grouped in four ways. The first grouping, by response, is often the most revealing:
| Response group | What it usually means | When to worry |
|---|---|---|
| OK (200) | Normal successful fetches | Never on its own; this should be the largest group |
| Not modified (304) | Page unchanged since the last crawl, confirmed through caching headers | Not a problem; a healthy share is a sign of efficient crawling |
| Moved permanently / temporarily (301, 302) | Googlebot followed redirects | A large share suggests internal links, sitemaps or canonicals point to redirected URLs |
| Not found (404) | Requested URLs do not exist | Normal in small numbers; a big or growing share points to broken links or removed pages still linked |
| Server error (5xx) | Your server failed to answer | Any sustained level; Google slows crawling when errors rise |
| Other client errors, DNS or fetch errors | Blocked requests, timeouts, unreachable host | If they appear regularly, check firewall and hosting |
Click any group to see example URLs. The examples are a sample, not a full list, but they usually reveal the pattern, such as one broken template generating 404s or a plugin creating redirected URLs. If 304 responses are missing entirely on a large site, our article on HTTP caching headers for SEO explains how to enable them.
Breakdowns by file type, purpose and Googlebot type
The other three groupings add context:
- By file type: HTML, images, JavaScript, CSS, JSON, PDF and others. If JavaScript and CSS take a large share, your pages depend on many resources; if “unknown” or “other” is large, look at the example URLs to see what they are.
- By purpose: discovery means URLs Google had not crawled before; refresh means re-crawls of known URLs. A site publishing lots of new content should see steady discovery. Mostly refresh with very little discovery on a site that publishes often can mean new pages are poorly linked or missing from sitemaps.
- By Googlebot type: smartphone, desktop, image, video, page resource load, AdsBot, StoreBot and others. Most sites see the smartphone crawler dominate because of mobile-first indexing. A sudden spike from AdsBot usually follows changes in ad campaigns.
Patterns that point to real problems
Most of the time the report shows ups and downs that need no action. These patterns are worth investigating:
- Response time climbs and crawl requests drop at the same time: the server is struggling, and Google is protecting it.
- A sudden sustained drop in requests with host status warnings: robots.txt errors, DNS failures or a firewall blocking Googlebot.
- A spike in requests to URLs you do not care about: parameters, filters, calendars or internal search pages creating near-infinite URL spaces.
- Growing 404 or redirect share after a redesign: old URLs still linked internally or in sitemaps.
- Download size jumps without new content: heavier pages, uncompressed responses or large images added to templates.
A drop in crawl requests is not automatically bad. After you remove thin pages or block junk URLs, fewer requests can mean Google is spending its time better. Always check the index coverage side too, using the Page Indexing report, before drawing conclusions.
A simple monthly routine
You do not need to watch the report every day. A short routine once a month, and after any significant change to the site, catches most problems early:
- Host status: confirm all three checks show no recent problems. If one does, click through and note the dates.
- Response time trend: compare the current level with the start of the 90-day window. A slow upward drift is easier to fix before it affects crawling.
- Server errors: open the 5xx group, even if the share looks small, and check whether the example URLs share a template or path.
- Redirect and 404 share: compare with last month. Growth usually has one cause, such as a changed URL pattern or a removed section still linked from menus.
- Discovery vs refresh: if you published a batch of new pages, check that discovery requests rose in the following days.
- Write it down: a short note with the numbers and any changes made to the site makes next month’s comparison much faster and helps connect cause and effect.
After a migration, redesign or hosting change, shorten the routine to a quick look every few days for the first weeks. That is when crawl problems appear, and when fixing them early saves the most traffic.
What the report cannot tell you
The report is a summary with samples, so it has limits. It covers only the last 90 days, it shows example URLs rather than every request, and it shows Google’s crawlers only, not Bing or AI crawlers. For complete detail you need your server access logs. It also does not tell you whether crawled pages were indexed or how they rank; those answers live in the Page Indexing and Performance reports.
For a page-by-page view of what a crawler meets on your site, a full audit crawl complements it. Site SEO AI Audit crawls your site like a search engine and reports status codes, redirect chains, orphan pages, click depth, server response on every page, compression and page weight, with fixes ranked by impact. Start with a free audit and compare its findings with the patterns in your Crawl Stats report.
Related reading
- URL Inspection Tool: How to Debug a Page Like Google
- HTTP Status Codes for SEO: The Ones That Actually Matter
- Technical SEO Monitoring: Catch Problems Before Traffic Drops
The bottom line
The Crawl Stats report shows how Googlebot experiences your server. Check host status first, then read requests, download size and response time together, and use the response, file type, purpose and crawler breakdowns to find patterns. Act on sustained server errors, slow responses and crawling of junk URLs, and confirm conclusions with indexing data and server logs.
FAQ
Where is the Crawl Stats report in Search Console?
Open Settings in Search Console and click Open report next to Crawl stats. It is available for domain properties and URL-prefix properties at the root of a host, not for subfolder properties.
What is a good average response time in Crawl Stats?
There is no official threshold, but faster is better. Many well-run sites stay in the low hundreds of milliseconds. What matters most is stability: a steady rise often comes before Google reduces crawling.
Why did my crawl requests drop suddenly?
Common causes are server errors, slow responses, robots.txt fetch failures or a firewall blocking Googlebot. It can also follow a cleanup of junk URLs, in which case it is harmless. Check host status and response codes first.
Is a high number of 304 responses a problem?
No. A 304 means the page has not changed since Google’s last visit, so it did not need to download it again. It is a sign that caching headers work and crawling is efficient.
Does the Crawl Stats report include AI crawlers?
No. It shows Google’s crawlers only. To see Bing, AI crawlers or other bots, you need your server access logs or a log analysis tool.