ENEnglish
 LTLietuviškai
 DEDeutsch
 FRFrançais
 RUРусский
 ESEspañol
 PLPolski
 ITItaliano
 UKУкраїнська
 CSČeština
 PTPortuguês
 JA日本語
JA日本語 LVLatviešu valoda
 ETEesti
 HUMagyar
 IDBahasa Indonesia
 TRTürkçe
 HIहिन्दी
 ELΕλληνικά
 ARالعربية
 THไทย
THไทย VITiếng Việt
 RORomână
 MSBahasa Melayu
 BNবাংলা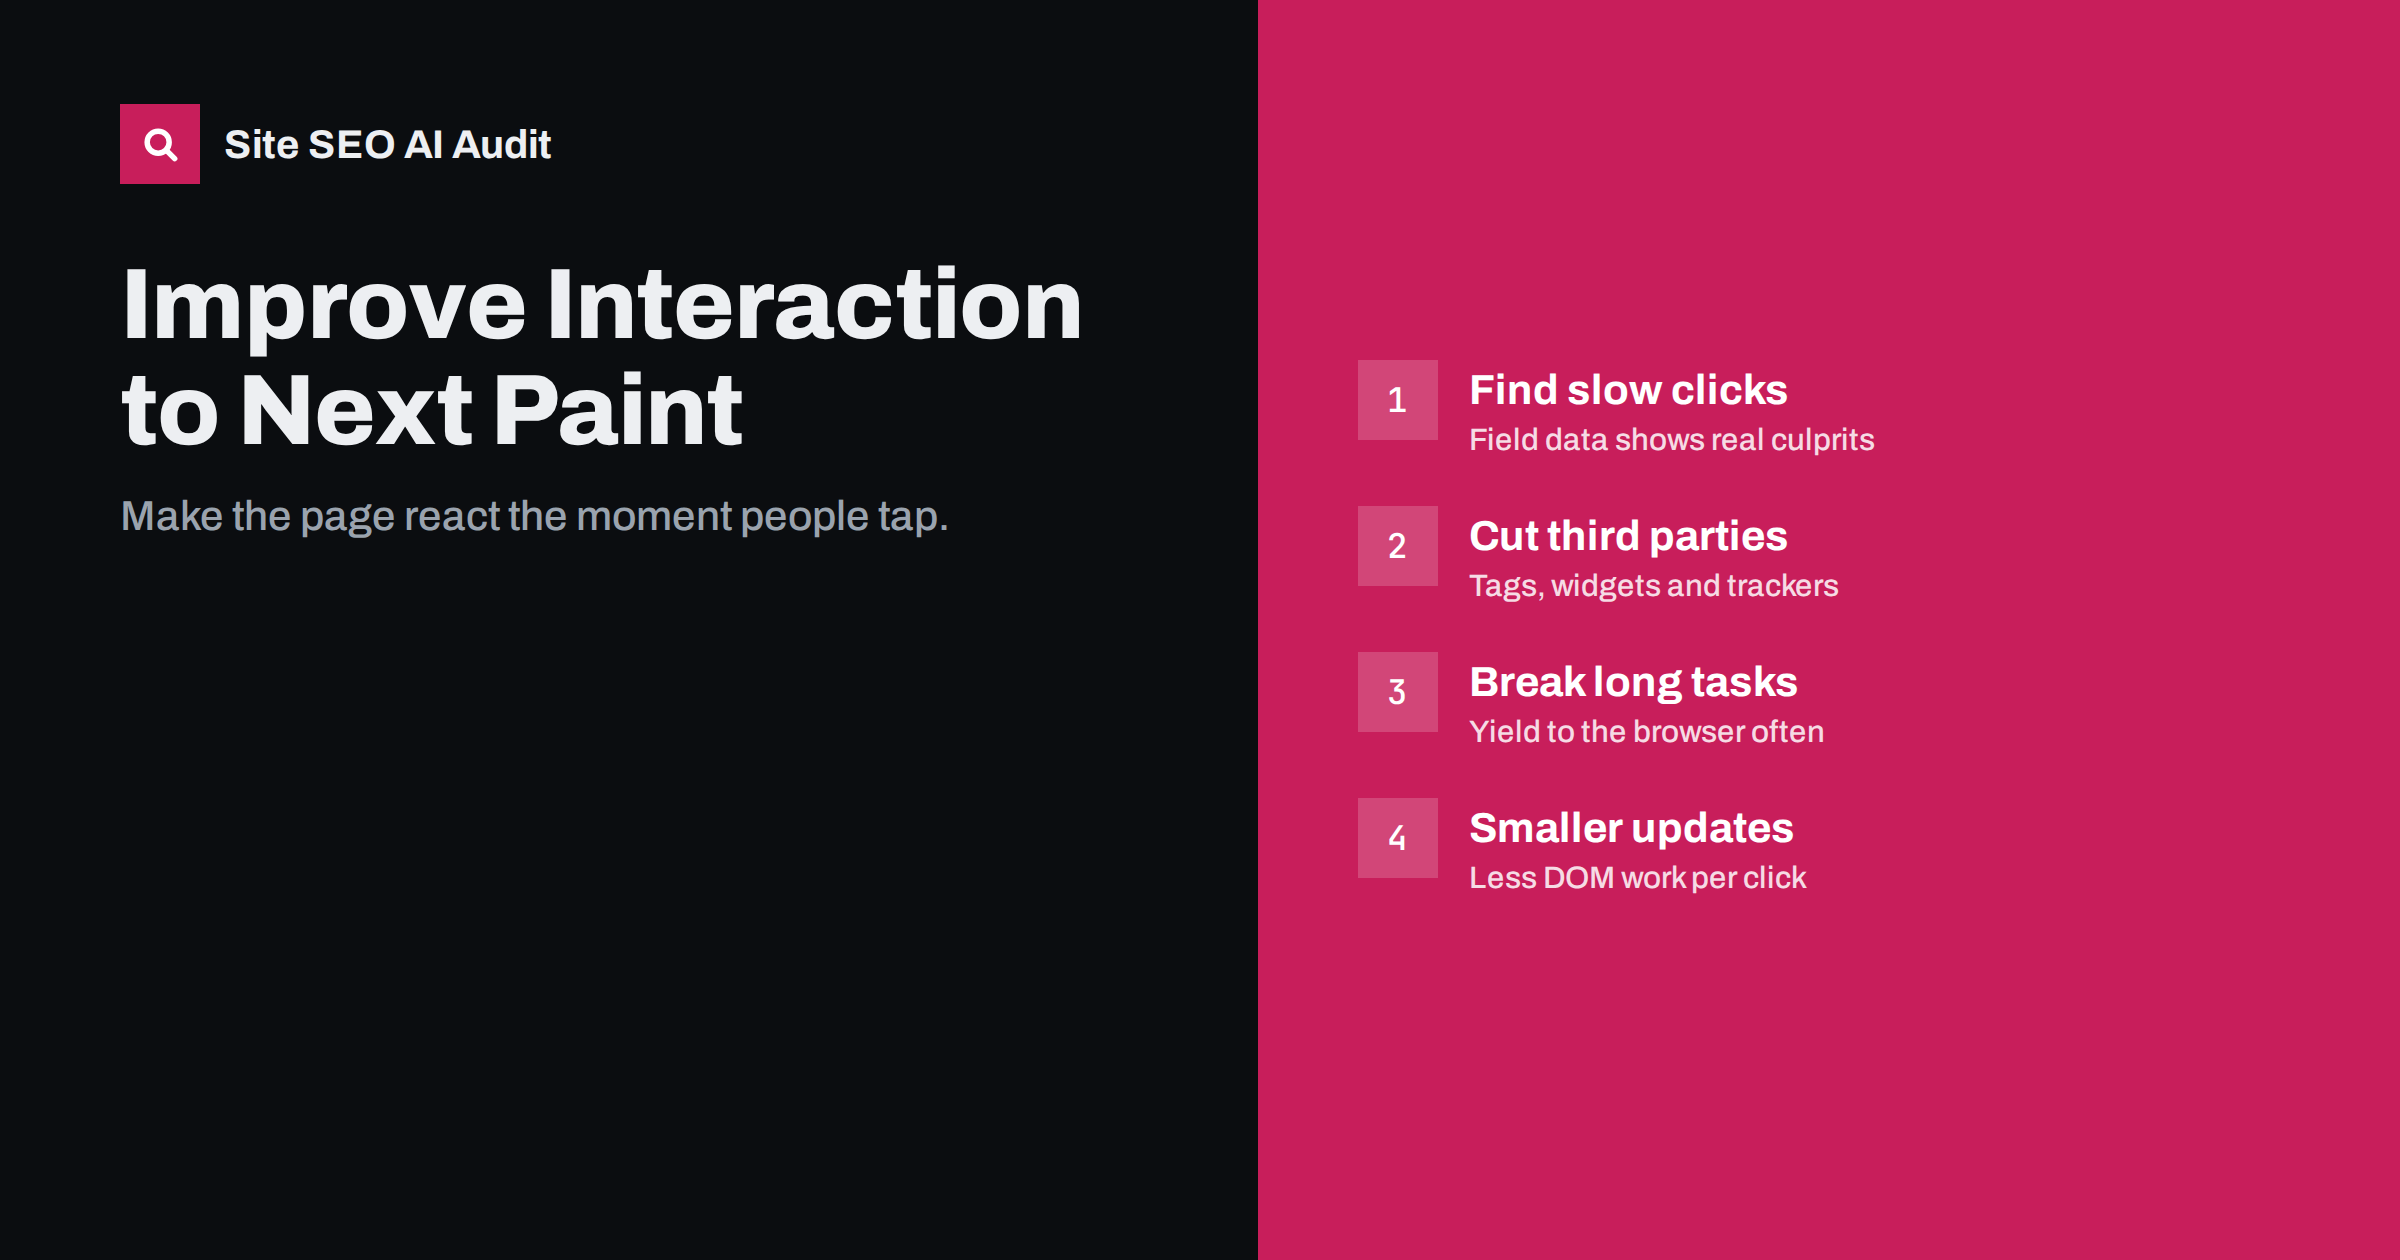
Short answer: Interaction to Next Paint (INP) measures how long a page takes to visibly respond after a click, tap or key press, reported close to the slowest interaction of a visit. A good INP is 200 milliseconds or less for 75% of visits. Poor INP is almost always caused by JavaScript occupying the browser’s main thread, so the fixes are to remove or delay unnecessary scripts, split long tasks, and make event handlers do less work before updating the screen.
What INP measures
INP became a Core Web Vital in March 2024, replacing First Input Delay (FID). FID only measured the delay before the browser started handling the first interaction. INP is stricter and more realistic: it looks at every interaction during the visit and measures the full time until the next frame is painted, including the time spent running your code.
Each interaction’s latency has three parts:
- Input delay: the time the interaction waits because the main thread is busy with other work.
- Processing time: the time your event handlers take to run.
- Presentation delay: the time the browser needs to recalculate styles, lay out and paint the result.
The page’s INP is the longest interaction latency, with a small allowance for outliers on pages with many interactions. Thresholds: 200 ms or less is good, up to 500 ms needs improvement, and above 500 ms is poor. Google explains the metric on web.dev’s INP page.
Why INP is often worse than expected
Many sites that passed FID easily fail INP. The reasons are practical:
- Lab tools like Lighthouse do not click anything, so a perfect lab score says little about INP.
- Most visitors use mid-range phones, where JavaScript runs several times slower than on a developer’s laptop.
- Interactions later in the visit, such as opening a filter panel or adding to cart, can be much slower than the first click.
- Third-party scripts added over the years accumulate and compete for the main thread.
Step 1: find the slow interactions
You need to know which interactions are slow and on which pages:
- Search Console’s Core Web Vitals report shows which URL groups have poor INP on mobile and desktop.
- PageSpeed Insights shows field INP for a URL or origin when there is enough data.
- Real user monitoring with an INP attribution library tells you which element was interacted with, what kind of interaction it was and which part of the latency dominated. This is the most useful source for fixing.
- Chrome DevTools: record a Performance trace while you click menus, filters, tabs, add-to-cart buttons and forms, ideally with CPU throttling to mimic a phone. Look for long tasks around each interaction.
Typical slow interactions: opening the mobile menu, applying product filters, adding to cart, expanding accordions, typing into search boxes with live suggestions, and accepting cookie consent.
Steps 2 to 4: shorten each part of the latency
Once you know which interactions are slow, look at the trace to see which of the three parts dominates. A long wait before your handler starts points to input delay; a long handler points to processing time; a long gap between the handler finishing and the frame appearing points to presentation delay. Each has its own set of fixes.
Step 2: reduce input delay
Input delay means the page is busy doing something else when the user taps. The usual culprits are scripts running during and just after load:
- Audit third-party scripts. Tag managers often load analytics, ad pixels, heatmaps, chat widgets, A/B testing and social embeds. Remove what nobody uses, and load the rest after the page is interactive or on user action.
- Defer non-critical JavaScript with
deferor by loading it on idle. - Break up long tasks. Any task over 50 ms blocks interactions. Split heavy initialisation into smaller chunks and yield to the browser between them, for example with
setTimeoutor the newer scheduler APIs where supported. - Avoid timers and polling that repeatedly run heavy code in the background.
Step 3: reduce processing time
Processing time is your own event handler code. Ways to shorten it:
- Do the visible update first. Update the button state or open the menu immediately, then do analytics calls, data fetching and other secondary work afterwards.
- Debounce input handlers for search-as-you-type, so work is not repeated on every key press.
- Avoid heavy synchronous work such as sorting large lists or parsing big JSON inside a click handler.
- Check framework re-renders. In component frameworks, one click can trigger re-rendering of large parts of the page. Limit updates to the components that actually change.
Step 4: reduce presentation delay
After the code runs, the browser must recalculate styles and layout and paint. This gets slow when:
- the DOM is very large, with many thousands of elements, often from mega menus, long product grids or page builder markup;
- a change forces layout of the whole page, for example toggling a class on the
<body>; - code reads layout values and writes styles in alternation, causing repeated forced layouts;
- complex CSS effects such as large shadows and filters must be repainted.
Reducing DOM size, using content-visibility for off-screen sections and keeping style changes local all help.
INP problems by site type
| Site type | Typical slow interaction | Common cause | First fix |
|---|---|---|---|
| WordPress blog | Menu tap, cookie consent | Many plugin scripts, page builder DOM | Remove unused plugins, lighter theme |
| Online shop | Filters, add to cart, variant selection | Heavy filtering scripts, cart fragments | Server-side filtering, lighter handlers |
| Single-page app | Route changes, form inputs | Large re-renders | Limit component updates, split code |
| News or media site | Any tap during load | Ad and tracking scripts | Delay and reduce third parties |
Quick wins on WordPress and shop platforms
On platforms built from themes and plugins, INP problems usually come from accumulation rather than one bad script. Some changes that often help without a developer rebuild:
- Remove plugins that add front-end scripts but are barely used, such as sliders on one old page, social share counters, animation libraries and popup builders.
- Load plugin scripts only where needed. A contact form script does not need to run on every product page. Several performance plugins let you disable assets per page type.
- Replace heavy page builder sections on key templates with native blocks, which produce smaller DOMs.
- Choose a cookie consent tool that is light, because the consent click is often the very first interaction and many consent scripts are heavy.
- In shops, check cart and mini-cart scripts that refresh on every page, and filtering widgets that recalculate the whole product grid in the browser.
- Replace live chat widgets that load on page load with a lightweight button that loads the full widget only when clicked.
After each change, repeat the same interaction recording on a throttled CPU and compare the long tasks. Small, repeated improvements add up, and they also make pages lighter, which helps loading speed at the same time.
A practical checklist
- Identify templates with poor field INP in Search Console.
- List every third-party script on those templates and who owns it.
- Remove unused scripts; delay the rest until after load or until interaction.
- Record traces of key interactions on a throttled CPU and find long tasks.
- Make handlers update the screen first and do other work afterwards.
- Reduce DOM size on heavy templates.
- Deploy, then watch field INP over the following four weeks.
Does INP matter for SEO?
INP is part of Core Web Vitals, which are part of Google’s page experience signals. Like the other vitals, it is a modest ranking factor compared with relevance and content quality. Its larger impact is on users: a page that ignores taps for half a second feels broken, and visitors respond by tapping again, abandoning forms or leaving. For shops, slow add-to-cart and filter interactions directly affect sales.
How Site SEO AI Audit fits in
The audit’s speed and Core Web Vitals area uses Google PageSpeed data and measures server response time, compression and page weight on every crawled page. Heavy pages and slow templates stand out, which is often where INP problems live too, because the same scripts and page builders that add weight also block the main thread. For interaction-level detail, pair the audit with field data and DevTools traces. You can start with a free audit.
Related reading
- Core Web Vitals explained: LCP, INP and CLS in plain words
- How to fix a slow Largest Contentful Paint (LCP)
- How to fix Cumulative Layout Shift (CLS) on your site
The bottom line
INP measures how quickly a page responds to real interactions. Poor INP almost always means too much JavaScript on the main thread. Find the slow interactions with field data, cut and delay third-party scripts, split long tasks, update the screen before doing secondary work, and keep the DOM lean.
SSS
What is a good INP score?
200 milliseconds or less for at least 75% of page visits is good. Between 200 and 500 milliseconds needs improvement, and above 500 milliseconds is poor.
Why can Lighthouse not measure INP?
INP needs real interactions, and a standard Lighthouse run only loads the page without clicking or typing. Lighthouse shows Total Blocking Time, which correlates with input delay, but real INP comes from field data.
Do third-party scripts affect INP?
Very often, yes. Analytics, ads, chat widgets, heatmaps and testing tools all run on the main thread. When they execute during an interaction, the page cannot respond until they finish.
Does a faster server improve INP?
Not much. INP is mostly about what happens in the browser after the page loads. Server speed matters when an interaction waits for a network request before showing any feedback, which is why showing immediate visual feedback helps.
How is INP different from First Input Delay?
First Input Delay measured only the waiting time before the first interaction was handled. INP measures the full latency of all interactions, including processing and rendering, and reports one of the slowest.