ENEnglish
 LTLietuviškai
 DEDeutsch
 FRFrançais
 RUРусский
 ESEspañol
 PLPolski
 ITItaliano
 UKУкраїнська
 CSČeština
 PTPortuguês
 JA日本語
JA日本語 LVLatviešu valoda
 ETEesti
 HUMagyar
 IDBahasa Indonesia
 TRTürkçe
 HIहिन्दी
 ELΕλληνικά
 ARالعربية
 THไทย
THไทย VITiếng Việt
 RORomână
 MSBahasa Melayu
 BNবাংলা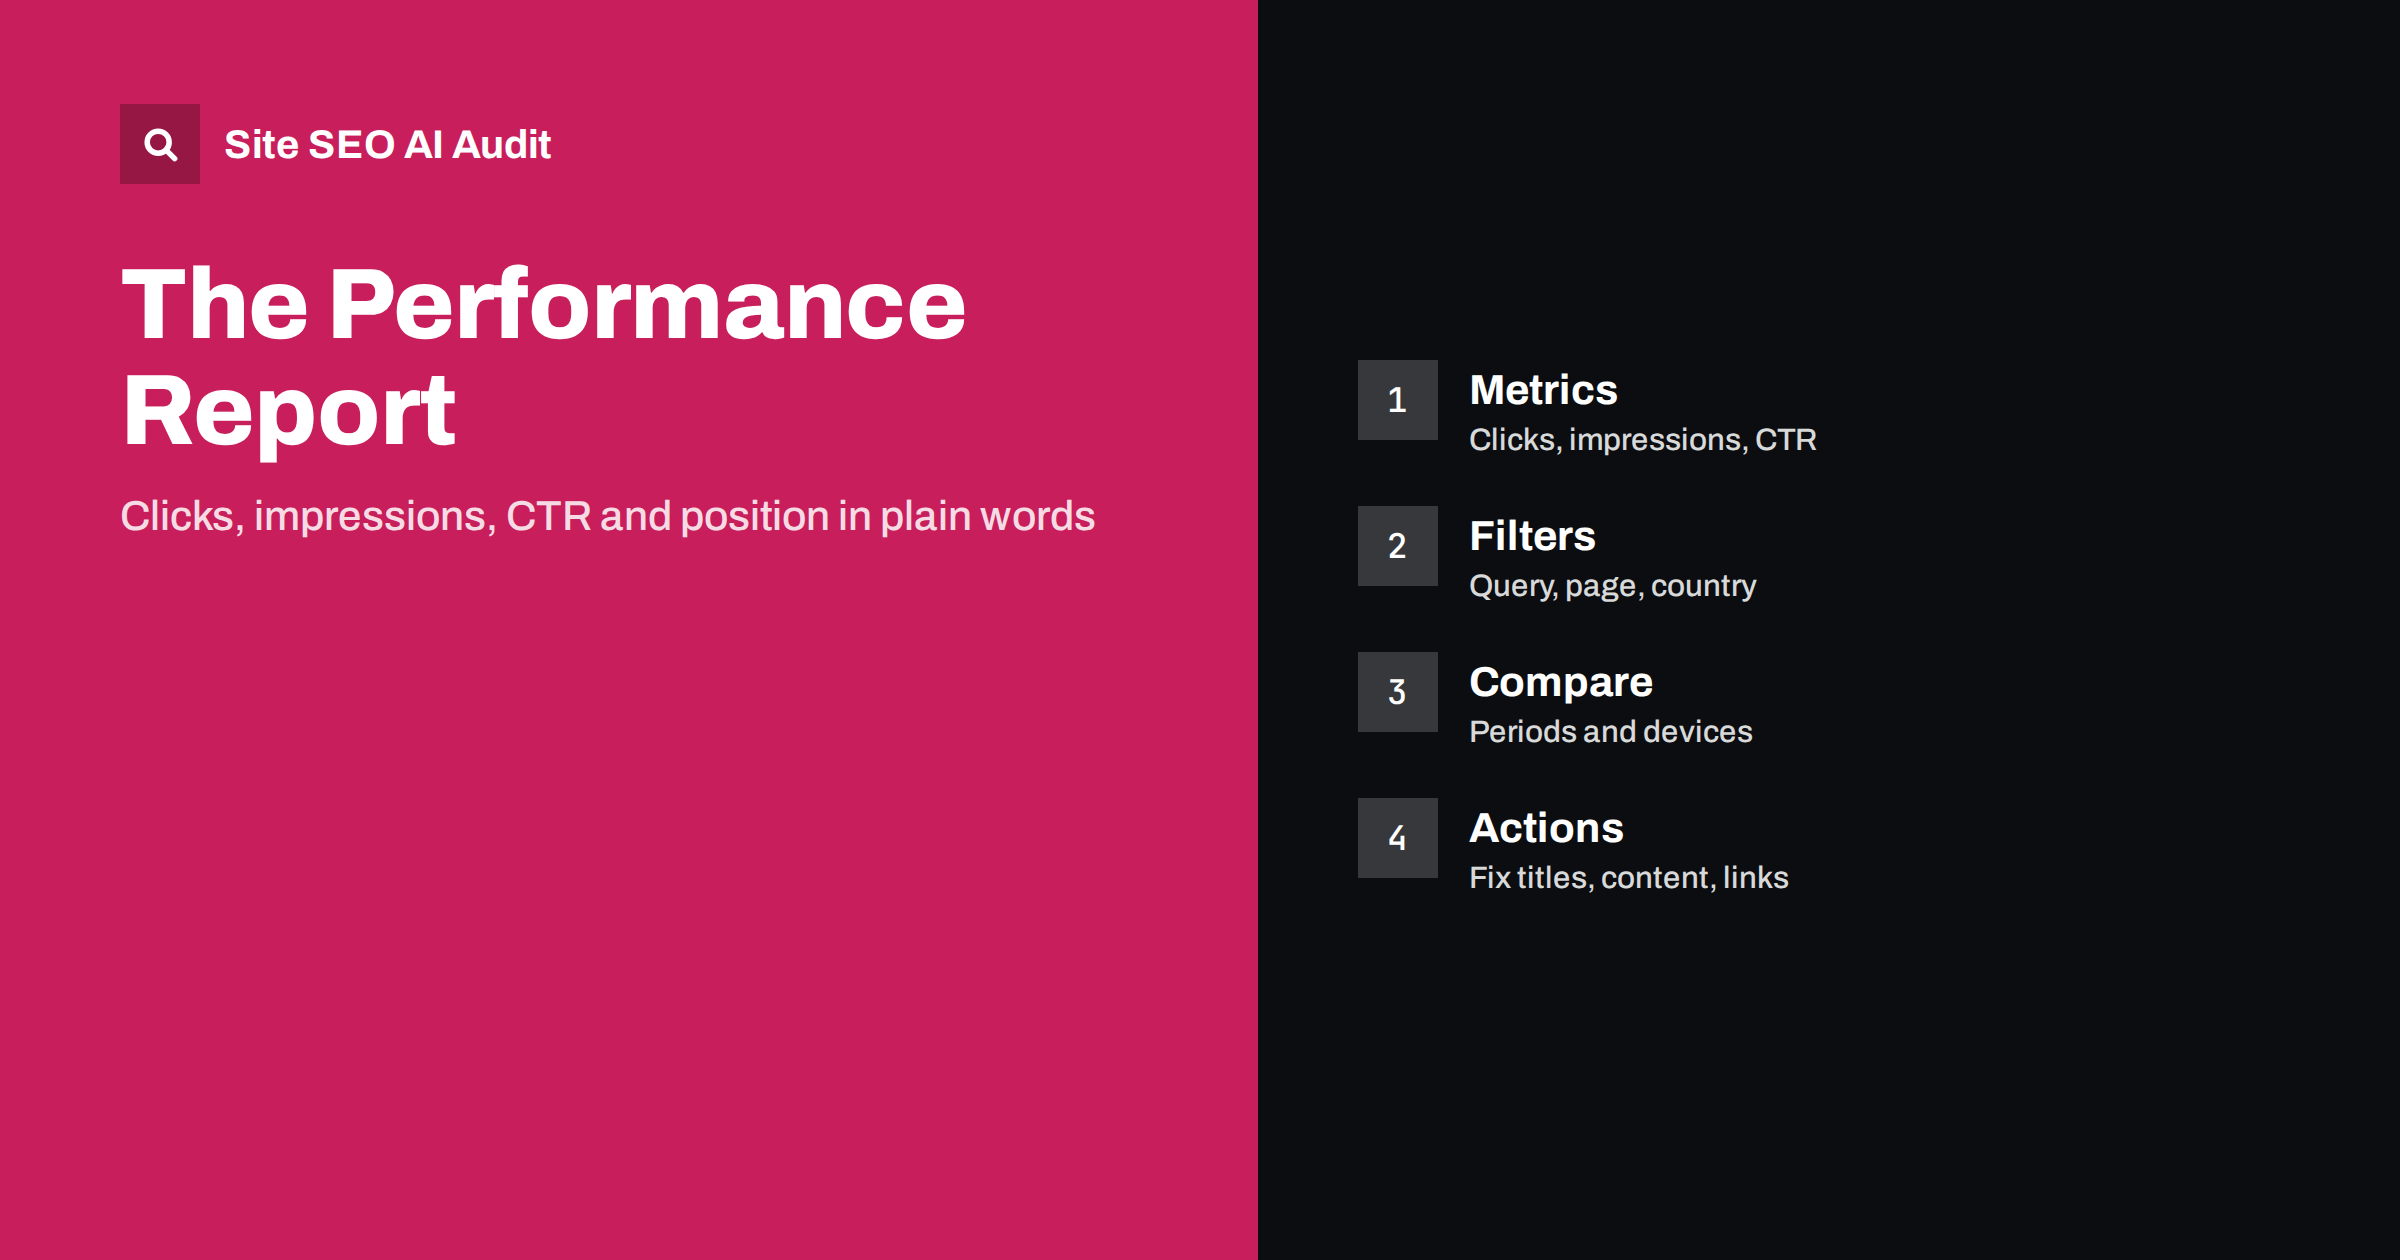
Short answer: The Search Console performance report shows how often your pages appeared in Google results (impressions), how often people clicked (clicks), the click-through rate (CTR) and your average position. Read it by filtering for one page, query, country or device at a time, comparing periods of equal length, and looking for pages with many impressions but weak CTR or positions just below the first page. Then turn each pattern into a specific edit.
Most site owners open the performance report, look at the line chart and close it. The chart is the least useful part. The value sits in the tables below it, in the filters and in comparisons, where you can see which queries bring visitors, which pages are almost ranking and which changes had an effect. This guide explains each metric and its limits, shows how to use filters, and gives a routine that takes about half an hour a week. If you have not set up the tool yet, start with the Search Console setup guide.
What the four metrics mean
- Impressions. The number of times a link to your site appeared in a result that a person could have seen. It does not always mean the person scrolled to it. A rise means you are shown for more queries or in better places.
- Clicks. The number of times people clicked through to your site from the results.
- CTR. Clicks divided by impressions. It depends heavily on position, the type of query and the features on the page, such as answers or maps.
- Average position. The average of the highest position your site held for each impression. It is an average over many queries and times, so it can move without any change to the page. Use it for pages and queries, not for the whole site.
Two cautions apply. First, the data is sampled in some views and some queries are hidden for privacy, so totals by query may be lower than total clicks. Second, the report shows search performance in Google only, so use other tools for other engines. For a related issue, see low CTR: impressions but no clicks.
Choose the right search type and date range
The default view shows web search. Switch the search type to see image, video or news results when they matter to your site. Choose a date range long enough to be stable. Sixteen months of history is available, which lets you compare the same season from last year. For a weekly check use the last 28 days compared with the previous 28 days. For a seasonal business compare with the same period a year earlier. Avoid comparing a period that includes a holiday with one that does not, unless you want to see exactly that effect.
Remember that data arrives with a delay of about a day or two, and the most recent days can be incomplete. Do not react to one low day.
Use filters to answer a question at a time
Filters turn the report from a general overview into a diagnostic tool. Add one filter and look at the result:
- Page: choose a URL to see its queries. This shows what the page actually ranks for, which is often different from what you intended.
- Query: choose a query, or a pattern with a regular expression, to see which of your pages appear and whether more than one competes. See keyword cannibalization.
- Country: check each target market separately. See Search Console for international sites.
- Device: compare mobile and desktop. A large gap in CTR or position can point to a mobile layout or speed problem.
- Search appearance: if available, view rich results, videos or other enhanced types.
Group queries into themes. A filter with a regular expression lets you see all question queries, all queries that include your brand name, or all queries that include a product type. Brand and non-brand queries behave differently, so compare them separately. A rise in brand queries shows growing awareness, and a rise in non-brand queries shows broader reach.
Compare periods and spot patterns
Use the compare option to place two date ranges side by side. Sort the table by the difference in clicks to find winners and losers. Then ask why. A drop on one page may come from a lost position, a title change, a new competitor, a removed link or a change in the results page. A drop across the whole site may point to a technical issue, a core update or tracking changes. Check the timeline of releases and edits. For help with large declines, see AI Overviews and traffic drops.
Common patterns and what they suggest:
- High impressions, low CTR, good position: the title or description does not attract clicks, or an answer on the page satisfies the query. See how to write title tags and zero-click search.
- Positions 8 to 20 with many impressions: the page is close to a top spot. Improve content depth, add internal links and refresh the page. See how to refresh old posts.
- Clicks falling while impressions stay flat: your listing lost attention. Look at titles, rich results and new features above you.
- Impressions rising with no clicks: you are shown for loosely related queries. Check search intent and page focus. See search intent.
- A page with clicks from unexpected queries: consider a new section or a separate page for that topic.
- Sudden zero for a page: check indexing, canonicals and robots rules. See the page indexing report.
Turn data into an action list
A report is only useful if it leads to changes. Build a simple weekly routine:
- Compare the last 28 days with the previous 28 and note the top five winners and losers by clicks.
- Open the page filter for two of them and read their queries.
- List pages with high impressions and CTR below what you expect for their position, and rewrite their titles and descriptions.
- List pages in positions 8 to 20 and choose one to improve, with more detail, better examples, a clearer answer and extra internal links.
- Check queries that should lead to a specific page but show another. Fix the internal links or merge overlapping pages.
- Write down every change with the date, so you can judge its effect later.
Give each change a few weeks before judging, since search engines need time to recrawl and reassess. Change one thing at a time on key pages, otherwise you will not know what worked.
Combine the report with other data
The performance report shows what happens on the results page. Analytics shows what visitors do after arriving. Together they show whether a query brings the right audience. Add the crawl stats report for server health (see the crawl stats report guide) and the indexing reports for coverage problems. For AI-driven visits, the search report will not show everything, so check how to track AI referral traffic in GA4. To build a measurement habit, read technical SEO monitoring.
The report also cannot tell you why a page is weak. For that, crawl your site and check the page itself. Site SEO AI Audit checks titles, descriptions, headings, canonicals, links, structured data and speed on every page, and ranks the fixes by how many points each adds. The first audit of up to 200 pages is free, so you can match your weakest pages in the performance report with their technical findings.
Mistakes to avoid
- Judging success by average position of the whole site.
- Reading one day or one week in isolation.
- Ignoring country and device filters.
- Mixing brand and non-brand queries.
- Making many changes at once and then guessing what worked.
- Exporting data only when a problem appears. Keep a monthly export, because the report keeps a limited history.
A worked example
Imagine a guide that has 20,000 impressions in 28 days, 200 clicks and an average position of 9. That is a CTR of 1 percent. When you filter by the page, you see that most impressions come from a broad query where you sit at position 11, while a narrower question brings fewer impressions but a higher CTR at position 4. The action is clear. Improve the section that answers the broad query, add a stronger comparison and internal links to lift it onto the first page, and rewrite the title so that it promises the specific answer that readers want. After a month, compare the same page and query again. If impressions held and the position improved, you have a result that you can repeat on other pages.
The same method works for decline. If a page lost half its clicks, check whether the position fell or whether CTR dropped at an unchanged position. A fall in position points to content, links or competitors. A fall in CTR at the same position points to the listing, a new feature on the results page, or a seasonal change in interest.
Related reading
- Search Console setup guide
- Low CTR: impressions but no clicks
- The crawl stats report guide
- The page indexing report explained
The bottom line
The performance report is a diagnostic tool, not a scoreboard. Understand the four metrics, filter by page, query, country and device, compare equal periods and look for patterns such as weak CTR and near-top positions. Turn each pattern into one edit, record it and check the result after a few weeks.
SSS
What is a good CTR in Search Console?
There is no single number. CTR depends on position, the type of query and the features shown. Compare your pages with similar queries and positions on your own site.
Why do my impressions go up while clicks stay flat?
You may be shown for more queries at low positions, or results may include features that answer the question without a click. Check which queries added the impressions.
Why are my query totals lower than total clicks?
Some queries are anonymized for privacy and do not appear in the table, although their clicks are in the totals.
How often should I check the report?
A weekly review of 28-day comparisons is enough for most sites. Check sooner after a major release or when you notice a change in traffic.
Does average position tell me my ranking?
Not exactly. It averages many queries, locations and times. Use it for a specific page or query, and look at the trend rather than a single value.