ENEnglish
 LTLietuviškai
 DEDeutsch
 FRFrançais
 RUРусский
 ESEspañol
 PLPolski
 ITItaliano
 UKУкраїнська
 CSČeština
 PTPortuguês
 JA日本語
JA日本語 LVLatviešu valoda
 ETEesti
 HUMagyar
 IDBahasa Indonesia
 TRTürkçe
 HIहिन्दी
 ELΕλληνικά
 ARالعربية
 THไทย
THไทย VITiếng Việt
 RORomână
 MSBahasa Melayu
 BNবাংলা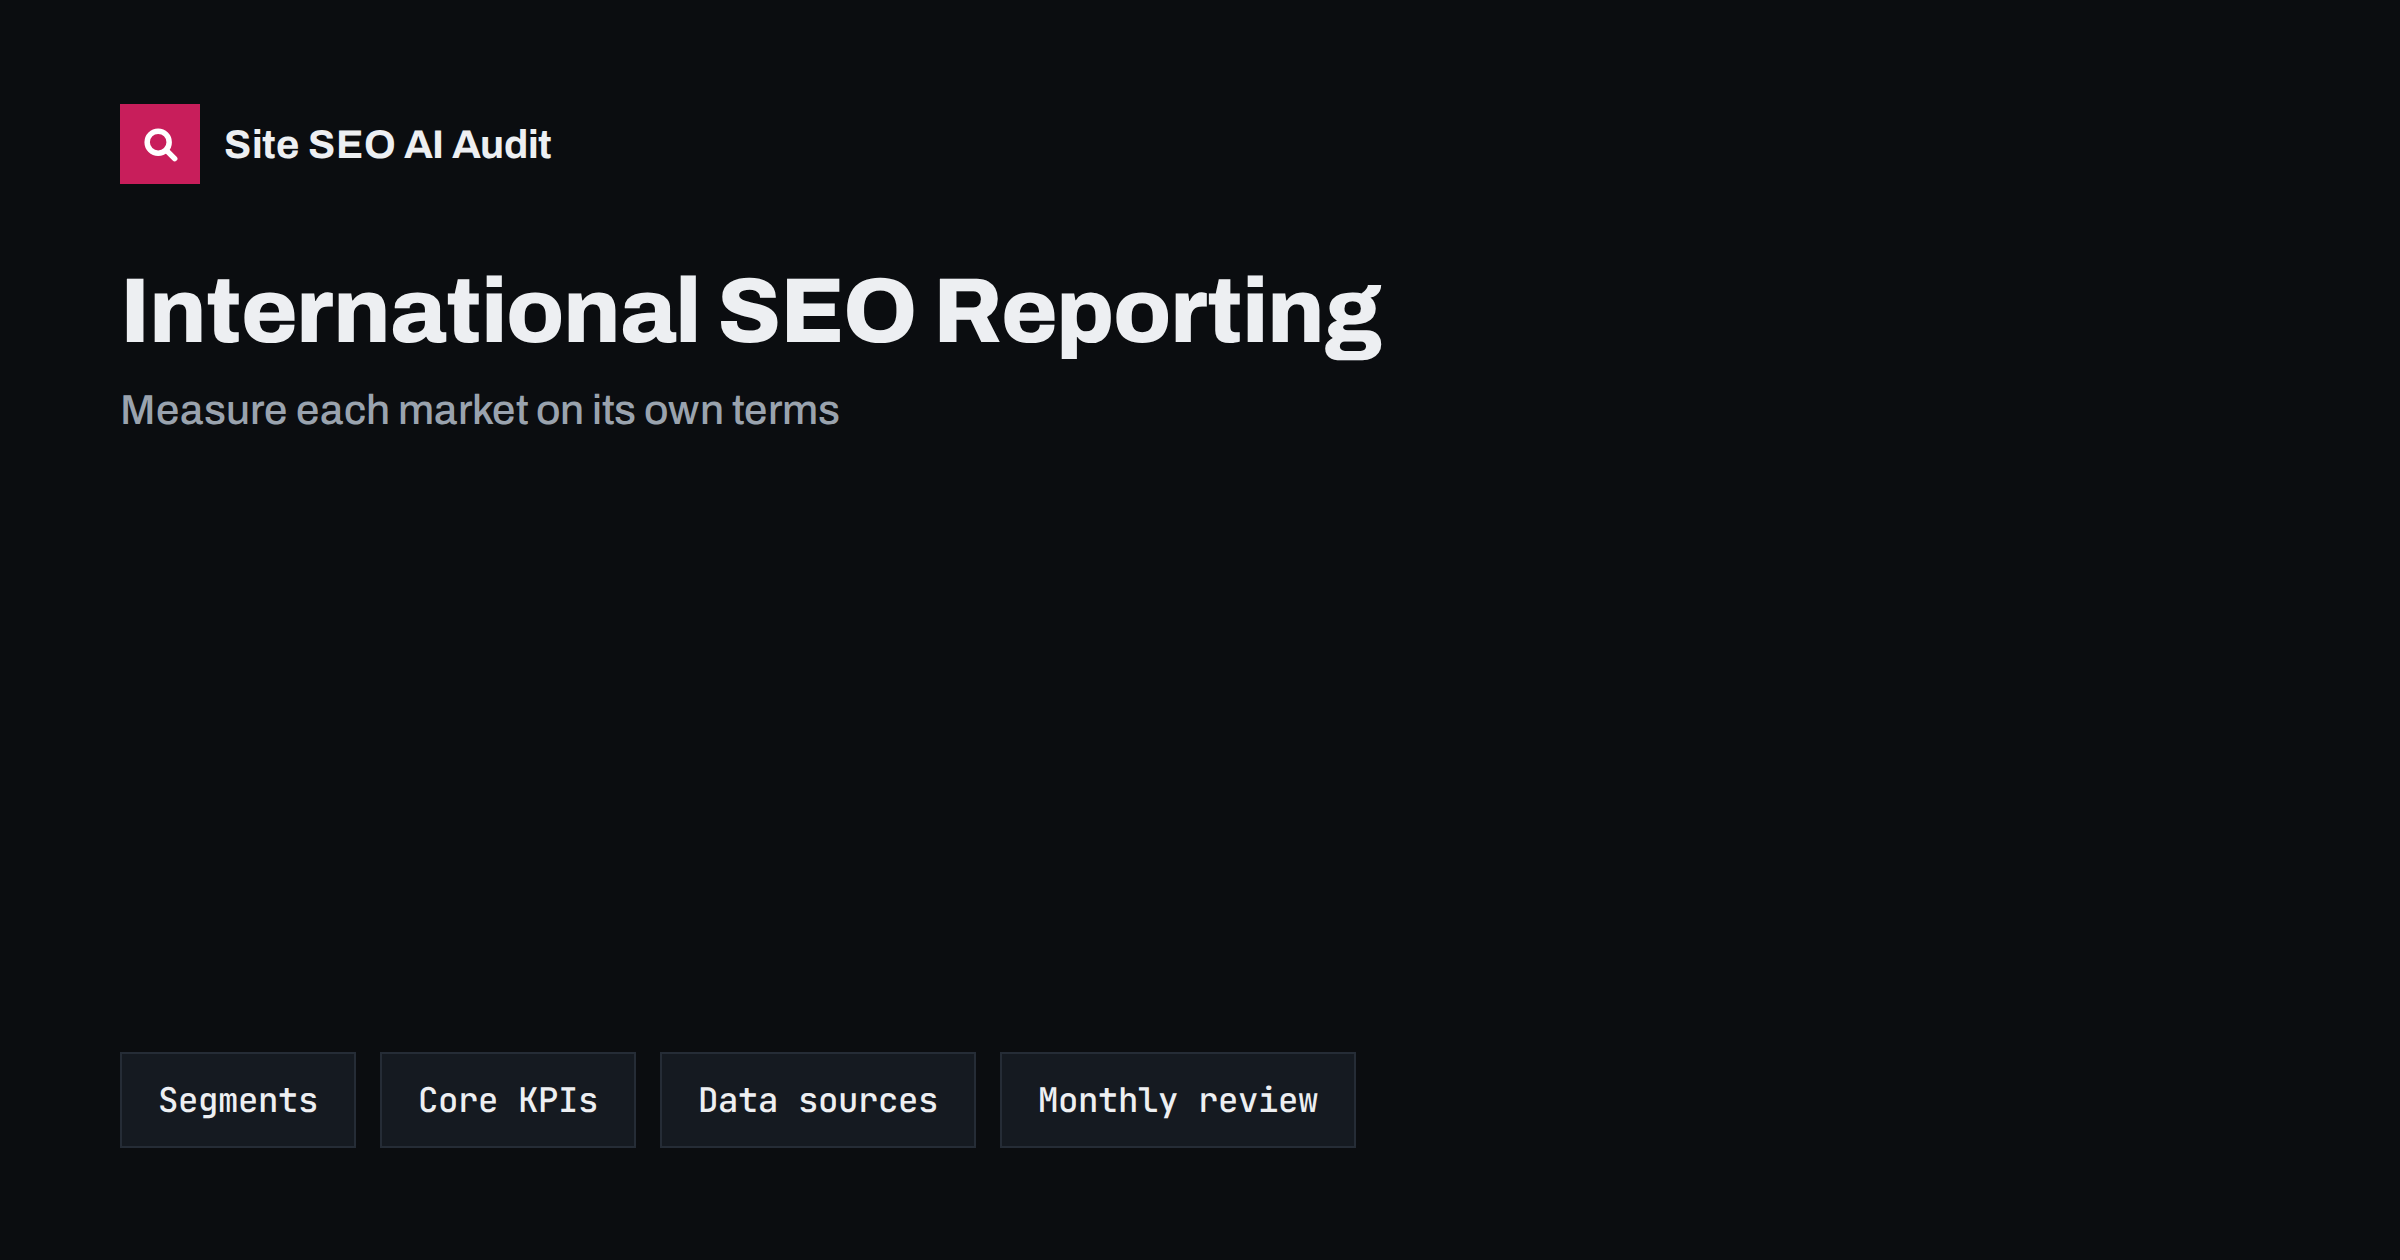
Short answer: International SEO reports should separate results by country and language, because a global total hides which markets grow and which fail. Track visibility, clicks, indexed pages, hreflang health and conversions for each market, use Search Console and analytics with consistent segments, compare each market with its own past and its own potential, and finish every report with decisions: what to fix, what to publish and what to stop.
When a company launches several language versions or country sites, reporting often stays as it was: one chart of organic traffic for the whole domain. That number can rise while one market collapses, or fall while three new markets are growing. A good international report answers market-level questions: Are we visible? Are the right pages shown in the right country? Do visitors act? What should the local team do next month? This guide describes a simple structure for that report.
Define the unit: market, language and site section
First decide what “a market” means for your site. Use a short table in your plan, with one row per market, and fix these definitions before you collect any data:
- Language: the language of the content, for example Spanish.
- Country: where you want to reach customers, for example Mexico.
- Site section: the folder, subdomain or domain that serves it, for example
/es-mx/. - Owner: the person or team responsible for results.
- Goal: what success means, such as leads, sales, sign-ups or store visits.
Language and country do not always match. A Spanish page may serve Spain, Mexico and the United States, while an English page serves many countries. Report both views: by section of your site, and by the country of the searcher. Our guide to multilingual versus multi-regional sites explains why the difference matters.
Choose a small set of KPIs
A long list of metrics is hard to read. Group indicators into four layers and pick a few from each:
- Technical health: indexed pages versus published pages, crawl errors, hreflang errors, wrong language versions served, page speed on local devices.
- Visibility: impressions, average position for priority queries, share of impressions from the target country, number of queries with impressions.
- Traffic: organic clicks, click-through rate, landing pages, new versus returning visitors.
- Business results: conversions, revenue or leads from organic visits, conversion rate, assisted conversions.
Business results matter most, but they lag behind. Visibility and technical health tell you early whether the market is on track. For a new market, expect indexing and impressions to move first, clicks later and revenue last.
Where the data comes from
You can build a solid report from free tools if you set them up with the right segments.
- Search Console. Create a property for each language folder or subdomain, in addition to the domain property. In the performance report, filter by country and compare queries and pages. See Search Console for international sites.
- Web analytics. Segment organic traffic by landing page folder, language and country of the visitor. Track conversions by market. Make sure consent settings do not distort the data differently from country to country.
- Crawl data. Regular crawls show hreflang errors, missing translations, redirect chains and indexing signals by section. See how to test hreflang.
- Rank tracking. Track priority keywords from the target country and in the local language, with the right device, since results differ by location.
- Business systems. Match web leads or orders with the CRM or shop data, so that you measure real outcomes.
Use the same date ranges and definitions every month, and write them down. Changing the method makes trends meaningless.
Check that the right page appears in the right country
A frequent international problem is that Google shows the wrong language or country version. Add a check to the report: for each market, list the top landing pages from Search Console and verify that they belong to the right section. If searchers in Germany land on the English page, or Canadian visitors see the United States page, review your hreflang, canonical tags and internal links. See wrong country version ranking and hreflang return links. Include the number of errors in your technical layer, and aim to reduce it every month.
Set targets that fit each market
Do not compare a mature home market with a new one. Give each market its own baseline and target:
- Use the last three to six months as a baseline, and take seasonality into account. See local seasonality and content planning.
- Estimate potential from search demand: the volume of local queries for your topics, not the size of the population.
- Define phases. Phase one is indexing and correct targeting. Phase two is visibility on priority queries. Phase three is conversions.
- Agree on realistic time frames. New sections often need several months before results appear.
Choosing where to invest starts earlier, with market selection. See choosing which countries to target first.
Build a one-page market scorecard
For each market, make a compact scorecard that fits on a single screen. A useful layout includes:
- The market, owner and goal.
- Four to six KPIs, with the current value, last month, same month last year and target.
- A trend line for impressions and clicks.
- The top five landing pages and top five queries.
- Open technical issues, such as pages not indexed or hreflang errors.
- Three decisions for next month.
Place all scorecards in one summary table so that leaders can compare markets quickly. Colour codes help, but add the numbers behind them. If a market has low traffic, avoid drawing strong conclusions from small samples, and show the count of queries or visits next to every percentage.
Common reporting mistakes
Several habits make international reports misleading, and they are worth avoiding from the start:
- Judging by the global total. A strong home market can mask weak markets for a long time.
- Mixing branded and non-branded queries. Brand searches often explain most of the clicks in a young market. Report non-branded visibility separately to see real discovery.
- Comparing different periods. A holiday month in one country cannot be compared with a normal month in another without context.
- Ignoring currency and tax effects. When you report revenue, convert at a fixed rate for trend analysis and note it.
- Counting translated pages as results. Published pages are an input. Indexed pages, impressions and conversions are results.
- Leaving out the local team. People who know the market can explain a change that the data cannot, such as a local event, a competitor launch or a change in regulation.
Add a short comment line to each scorecard in plain words. A sentence such as “clicks grew because the new pricing guide reached the first page” teaches more than another chart.
It also helps to agree on a glossary at the start. Decide what counts as an organic visit, a lead and a conversion, and use the same words in every language team. When a Japanese colleague and a Polish colleague both say “conversion rate” but mean different things, the combined report is wrong before it begins. A one-page definitions sheet, stored next to the dashboard, removes that risk and makes new team members productive faster.
Report AI search visibility too
Search is no longer only ten blue links. People ask assistants questions in their own language, and answers may cite your pages or not. Add a light layer of measurement to the report: sample a fixed list of questions per market in the local language, note whether your brand or pages appear, and record referral visits from AI platforms in analytics. Treat the results as a trend, not as exact data, because answers change. See AI search in other languages and how to track AI referral traffic in GA4.
Turn the report into decisions
A report that ends with charts changes nothing. End every monthly review with a short action list per market:
- Fix: hreflang errors, missing translations, broken links, slow pages.
- Publish: new pages for queries with impressions but no good page, or updates for pages that lost ground. See keeping translations in sync.
- Localize: prices, formats and trust signals. See local currency and prices.
- Stop: content that nobody reads or a market that shows no potential after a fair test.
Give each action an owner and a date. Review last month’s list first, because tracking what happened teaches the team what works. The roles that make this possible are described in running international SEO: roles, workflow and ownership.
Site SEO AI Audit reports hreflang return links, broken language versions, x-default, language attributes, titles, links and speed for every page it crawls, so the technical layer of your report stays current. The first audit of up to 200 pages is free.
Related reading
The bottom line
International SEO needs market-level measurement. Define each market clearly, track a few KPIs across technical health, visibility, traffic and results, use consistent segments and sources, set targets that fit each market and finish every review with owned actions. A modest report used every month beats a large one that nobody reads.
KKK
Which KPI matters most for a new market?
Indexing and impressions first, because they show whether search engines understand and show the pages. Clicks and conversions follow later.
Should I create separate Search Console properties?
Yes, for each language folder or subdomain, besides the domain property. This makes market-level reporting simpler.
How do I compare markets of different size?
Compare each market with its own baseline and target, and use rates such as click-through and conversion rate next to totals.
How often should I report?
Monthly is enough for most sites, with a weekly check on technical errors. Use year-over-year comparisons for seasonal businesses.
Can I rely on one global rank tracker?
No. Rankings differ by country, language and device, so track keywords from the right location and in the local language.