ENEnglish
 LTLietuviškai
 DEDeutsch
 FRFrançais
 RUРусский
 ESEspañol
 PLPolski
 ITItaliano
 UKУкраїнська
 CSČeština
 PTPortuguês
 JA日本語
JA日本語 LVLatviešu valoda
 ETEesti
 HUMagyar
 IDBahasa Indonesia
 TRTürkçe
 HIहिन्दी
 ELΕλληνικά
 ARالعربية
 THไทย
THไทย VITiếng Việt
 RORomână
 MSBahasa Melayu
 BNবাংলা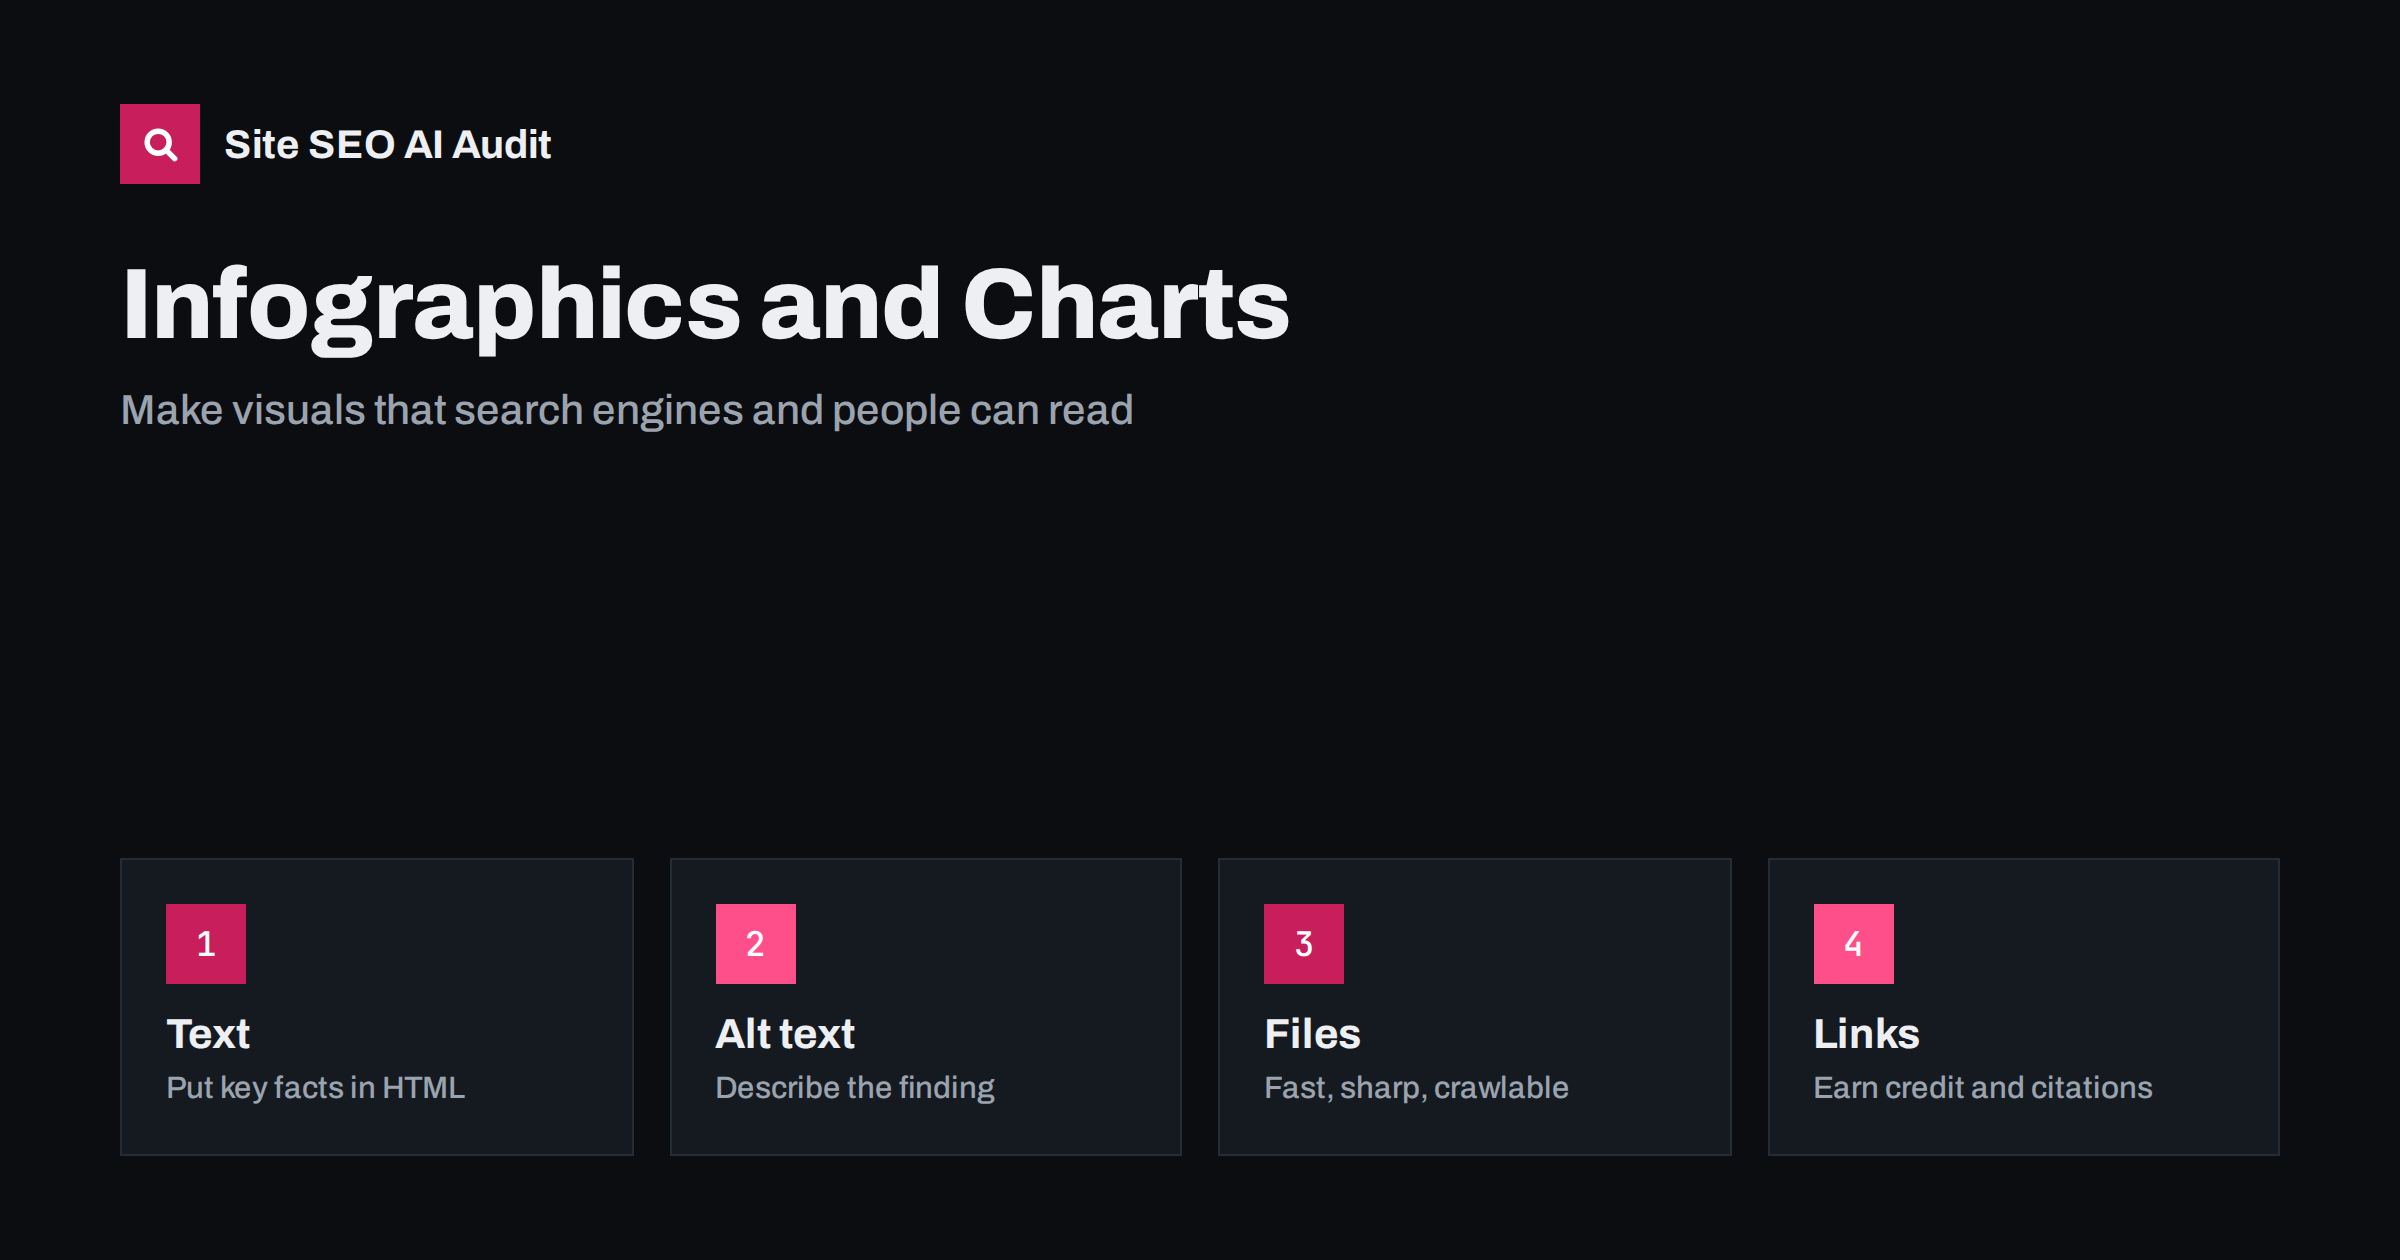
Short answer: A chart or infographic helps SEO when its message also exists as text on the page. Write a clear title and a short summary above the image, describe the main finding in alt text, put the underlying numbers in a table or list, name the source, keep files sharp and light, host them on a stable URL and give people an easy way to cite and share them. An image alone is invisible to most crawlers.
Visuals can explain a complex topic in seconds, and they are among the most shared forms of content. They also tend to fail quietly in search. A designer exports a tall graphic, the editor drops it into a post with a short caption, and the page ends up with almost no text for a search engine to understand. Meanwhile the real value, the data and the conclusion, is locked inside pixels. This guide shows how to make charts and infographics work for people, crawlers and AI systems, without losing the design.
Start with the question the visual answers
Every visual should answer one question or support one claim. “How the process works”, “what changed over five years”, “which option costs more” are all clear aims. Write that sentence first and use it as the title. Then decide whether a chart, a diagram, a table or a short list is the right format. Many infographics would work better as a simple chart with a good paragraph. Build them around a topic that people search for and that you can support with real information. See search intent for matching the format to the need.
Put the message in HTML text
Search engines can read text on a page far better than text drawn inside an image. Build the page around the visual with:
- A descriptive H1 and an introduction that states the main finding in the first lines. See answer-first introductions.
- A short written summary of the key points of the visual, in plain sentences.
- Section headings that follow the structure of the graphic, so each part has its own text.
- The data behind the chart in an HTML table or list, with units and dates. A table is easy for people to copy and for machines to quote.
- A source line that names where the data comes from and when it was collected.
For a long infographic, split the content into sections with text beside each part, rather than one extremely tall image. See heading structure for SEO. If the data is the point, the page can be rated as original research; see original research and AI citations.
Write alt text and captions that carry meaning
Alt text should say what the visual shows, including the main takeaway, in a sentence or two. “Bar chart showing page speed improved from 4.2 to 1.8 seconds after compression” is much better than “chart” or a string of keywords. For complex graphics, keep the alt text short and place the full description in the visible text or in a table nearby, since long alt text is hard to use. Add a caption when it helps readers: say what the figure shows, the period and the source.
Use a meaningful file name with words separated by hyphens, such as organic-traffic-growth-2026-chart.png, not IMG_4021.png. More details are in image alt text and image file names and captions. Accessibility and SEO overlap here: a description helps screen reader users and crawlers alike; see web accessibility and SEO.
Choose the right file type and size
Charts with text and sharp lines often work best as SVG, which stays crisp at any size, can be small, and can even keep its text readable by crawlers when it is embedded properly. Photographs and complex raster graphics suit modern formats such as WebP or AVIF. Avoid very tall images that must be scaled down so far that the text becomes unreadable on a phone. Practical steps:
- Design the graphic so the main message works at phone width, around 360 to 400 pixels, and offer a larger version for detail.
- Export at twice the displayed size for high-density screens, then compress.
- Serve responsive sizes with srcset. See responsive images and WebP and AVIF formats.
- Set width and height so the layout does not jump. See how to fix Cumulative Layout Shift.
- Lazy-load graphics below the fold, but not the first large visual. See lazy loading and SEO.
Make sure the image URL is stable and crawlable, and that the image is not blocked in robots.txt. Keep readable colors with enough contrast, and test them in dark and light themes if your site supports both.
Make the data useful and honest
Trust matters, particularly when others will cite your numbers. Do these things:
- Use real data and state how it was collected: sample, date range, method and limits.
- Show axes, units and scales honestly. A truncated axis can mislead and damages credibility.
- Avoid claims that the data cannot support, and distinguish correlation from cause.
- Name the author or team, and update the figure when the data changes. See content dates and freshness.
- Link to the primary source for numbers that come from elsewhere.
Visuals that present first-hand data are more likely to be cited by other sites and by AI answers than a redrawn version of widely available facts. See E-E-A-T and AI search.
Add structured data and a good page context
The page that hosts the visual should be a proper article or guide with its own title, description, author, date and, where suitable, structured data such as Article and FAQ markup. Some sites also mark up datasets, but only do so when you publish the underlying data openly and the markup is accurate. Add the visual to the page in a way that crawlers can find: an image element in the main content, not a background image set in a style sheet. Link to the visual’s host page from related articles. See structured data for AI search and internal linking strategy.
Earn links and credit without spam
Infographics used to be mass-produced for links, and many low-quality embeds were created. Today the useful approach is smaller. Make something that is worth citing, publish it on a stable page, and make it easy to attribute:
- Offer a downloadable image and a copy-ready credit line with the page URL.
- Provide an embed code only if it contains a visible, relevant link and the text of the visual.
- Tell relevant journalists, bloggers and partners about it with a short, specific note about what the data shows.
- Check where your images are used and ask for credit when they appear without a link.
- Keep the original page up to date so that citations lead to something accurate.
For more on earning links, see international link building. Avoid hidden links in embed code, which breaks the rules of search engines.
Common mistakes
- An infographic that carries the only copy of important text.
- Alt text such as “infographic” or a copy of the page title.
- Huge files that slow the page and hurt Core Web Vitals. See Core Web Vitals explained.
- Charts without a source or date.
- Rendering the chart only with a script that fails when JavaScript is blocked. See JavaScript SEO basics.
- Reusing the same graphic in many posts with no new context.
Check the page
After publishing, load the page with images switched off and read what remains. Is the message clear? Do headings tell the story? Is the data available as text? Then check size and speed in the field. An audit helps with the rest: Site SEO AI Audit reports missing image alt texts, page weight, structured data and speed issues across your pages, and the first audit of up to 200 pages is free. Fix the pages that have the most visuals first.
A last practical tip: plan the page before you design the graphic. Write the headline, summary, table and sources first, and let the designer work from them. This avoids the common situation where a finished picture contains claims that the text of the page does not support. It also makes updates easy, because a change to the data means editing a table and regenerating one image, not rewriting the whole page. Keep the source file of the design in a shared place, with the date and the author, so that the next update starts from the current version. Review the page twice a year, replace outdated numbers and note the update date in the visible text.
Related reading
- Image SEO: file names and captions
- Original research and AI citations
- Reduce page weight and compression
- Table of contents and jump links
The bottom line
Charts and infographics rank when the page around them explains them. State the finding in text, describe the image, provide the data in a table, cite the source, keep the file sharp and light, and make it easy for others to credit you. Then the visual works for readers, crawlers and assistants alike.
FAQ
Can search engines read text inside an infographic?
Some can recognize text in images, but you should not depend on it. Put the important text and data in HTML on the page.
How long should alt text be for a chart?
One or two sentences that state what the chart shows and the main takeaway. Put longer descriptions in visible text or a table.
Is SVG better than PNG for charts?
Often yes for simple charts, because it stays sharp and small. Photographic or complex graphics may be better in WebP or AVIF.
Do infographics still earn backlinks?
They can, when they contain useful original data and are easy to cite. Mass-produced graphics rarely do.
Should I offer an embed code?
Only if it includes a visible, relevant credit link and the text of the visual. Avoid hidden links, which break search engine rules.