ENEnglish
 LTLietuviškai
 DEDeutsch
 FRFrançais
 RUРусский
 ESEspañol
 PLPolski
 ITItaliano
 UKУкраїнська
 CSČeština
 PTPortuguês
 JA日本語
JA日本語 LVLatviešu valoda
 ETEesti
 HUMagyar
 IDBahasa Indonesia
 TRTürkçe
 HIहिन्दी
 ELΕλληνικά
 ARالعربية
 THไทย
THไทย VITiếng Việt
 RORomână
 MSBahasa Melayu
 BNবাংলা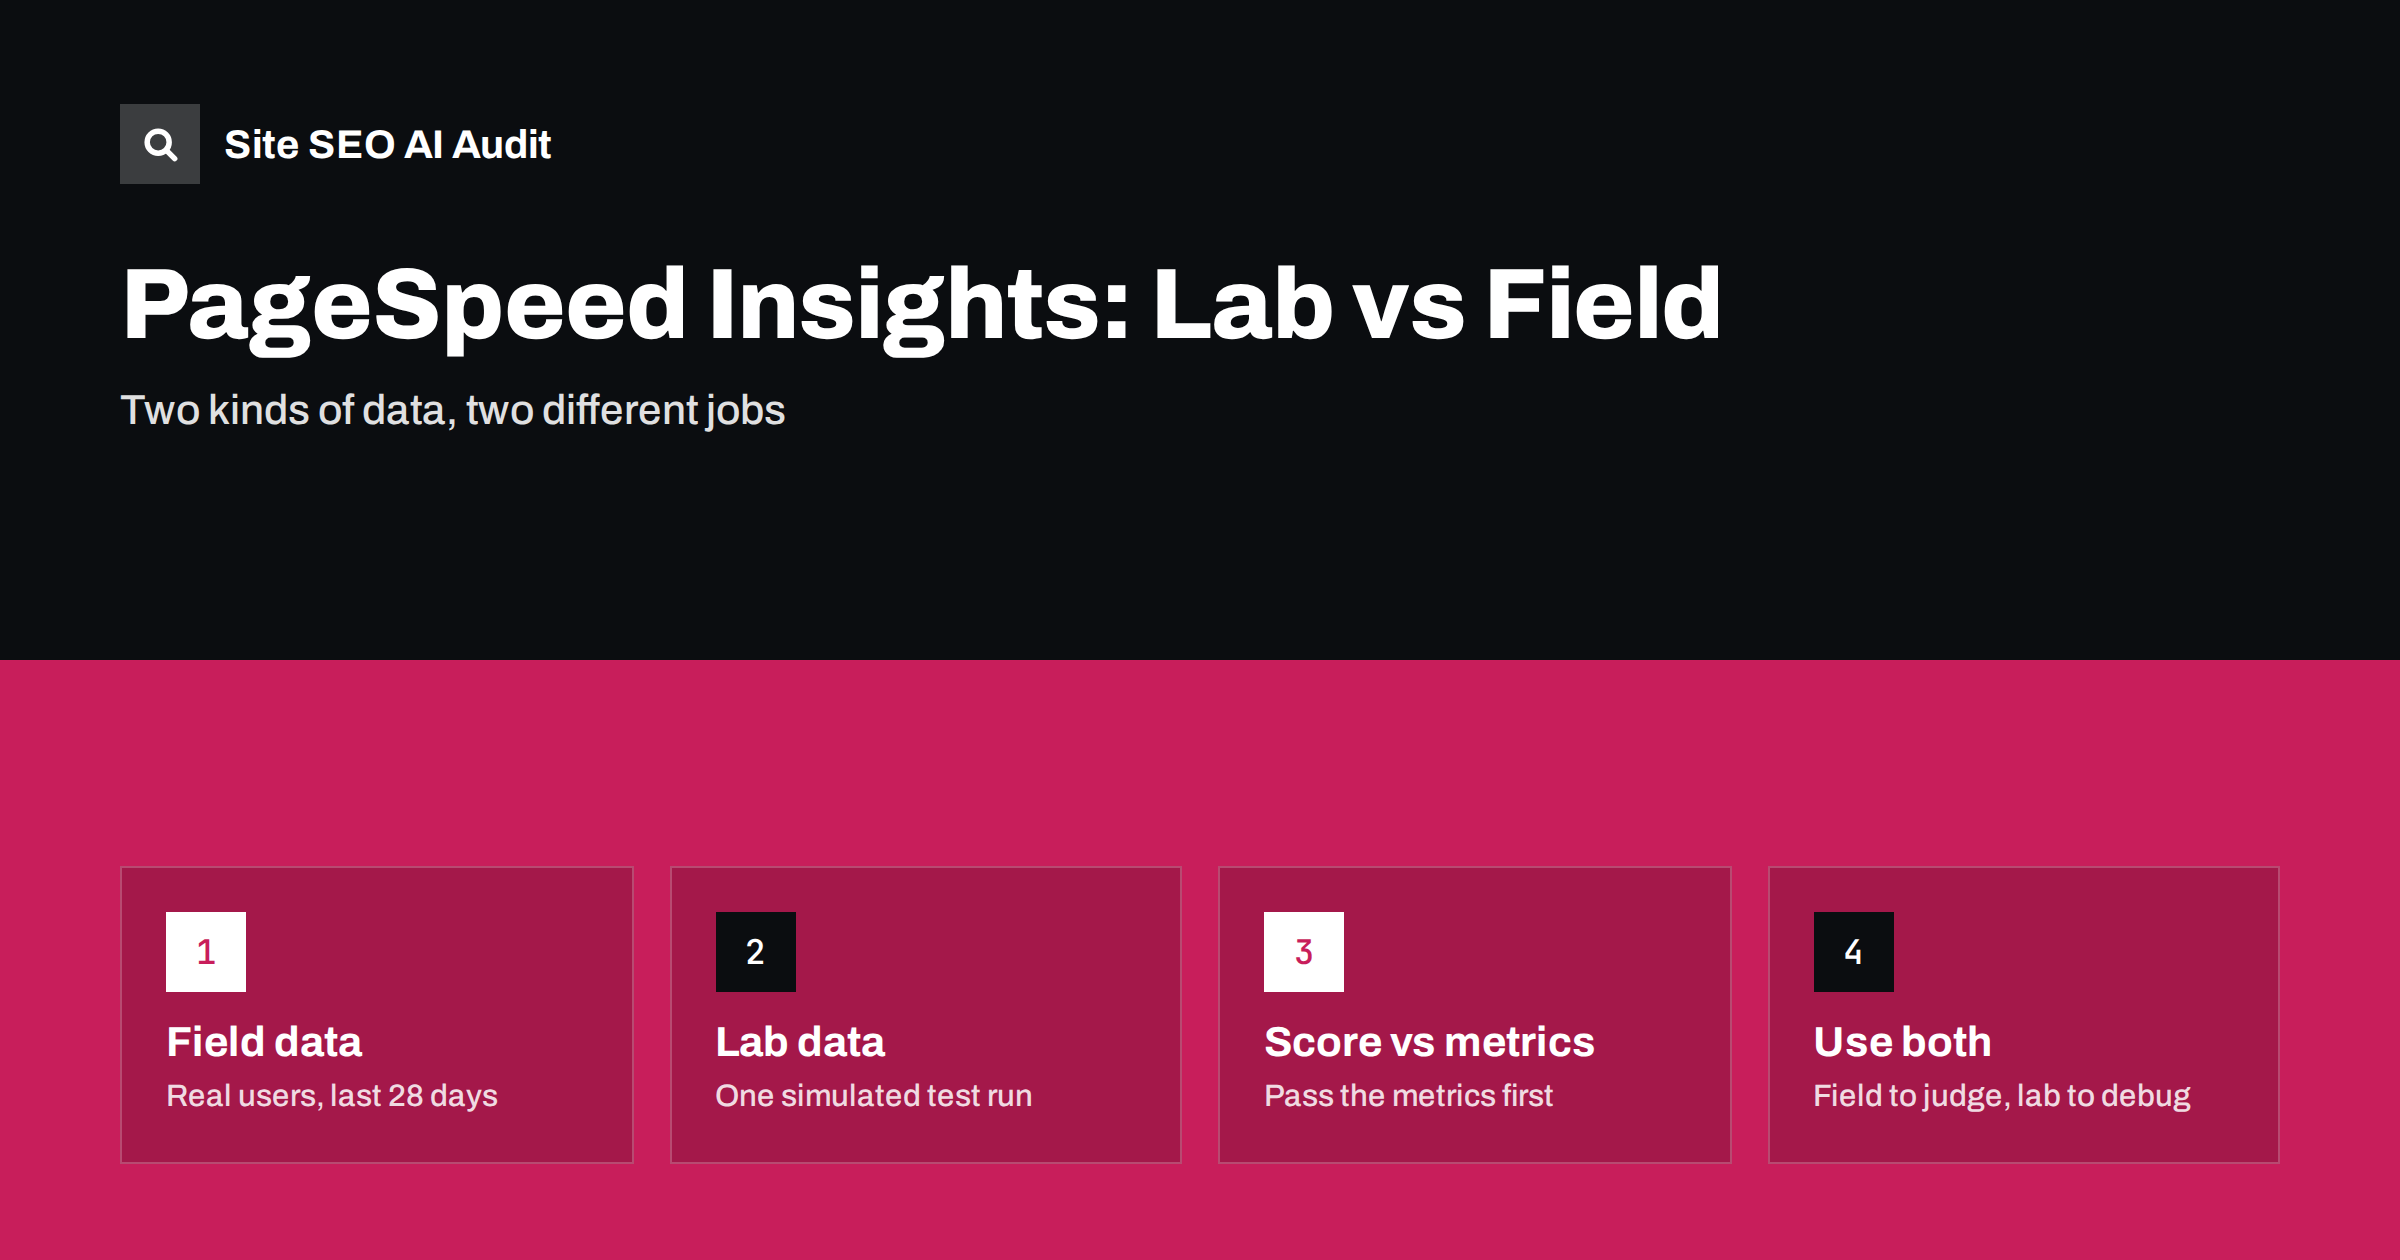
Short answer: PageSpeed Insights shows two different things. Field data, at the top, comes from real Chrome users who visited the page or site over the previous 28 days, and it is what Google’s page experience signals are based on. Lab data, below it, is a single simulated test run with Lighthouse on a throttled device, and it produces the 0–100 performance score. Use field data to judge whether a page passes Core Web Vitals, and lab data to find out why it is slow and to test fixes before real users see them.
Few tools cause as much confusion as PageSpeed Insights. A page scores 45 in the lab but passes Core Web Vitals in the field. Another page scores 95 and fails. Clients send screenshots of red numbers and ask why rankings have not fallen. All of this makes sense once you know that the report combines two kinds of measurement with different purposes.
The two sections of the report
When you test a URL, PageSpeed Insights shows a mobile and a desktop tab. Each tab has two main parts:
- “Discover what your real users are experiencing”: field data from the Chrome User Experience Report (CrUX). It shows Largest Contentful Paint (LCP), Interaction to Next Paint (INP) and Cumulative Layout Shift (CLS), plus some extra metrics, and an overall Core Web Vitals assessment of passed or failed.
- “Diagnose performance issues”: lab data from a Lighthouse run. It shows the performance score, lab metrics such as First Contentful Paint, LCP, Total Blocking Time, CLS and Speed Index, and a list of opportunities and diagnostics.
Google’s documentation on PageSpeed Insights describes both sources. The key point is that they answer different questions: “how fast is this page for real people?” and “what can I change to make it faster?”
Field data: what real users experience
Field data is collected from Chrome users who have opted in to sharing usage statistics. For each metric it reports the 75th percentile over a rolling 28-day window, which means three quarters of visits were at that value or better. A page passes the Core Web Vitals assessment when all three metrics are in the “good” range at the 75th percentile: LCP up to 2.5 seconds, INP up to 200 milliseconds and CLS up to 0.1. Our guide to Core Web Vitals explained covers each metric.
A few properties of field data matter in practice:
- It lags. A fix deployed today affects the numbers gradually over the next four weeks.
- It needs traffic. Pages without enough visits show no URL-level data; the report then falls back to origin-level data for the whole site, or shows nothing.
- It reflects your real audience. Slow phones, poor networks and distant countries all count. Two sites with the same code can have different field data.
- It includes interaction. INP measures how quickly the page responds to clicks and taps, which a lab test without user input cannot measure directly.
Pay attention to whether the report shows data for “This URL” or for the “Origin”. URL-level data describes only the tested page. Origin-level data combines all pages of the domain, so a fast home page can hide slow product pages, and a few heavy templates can drag down the whole origin. When you only see origin data, test several representative URLs and treat the result as a site-wide average, not as a verdict on the page in front of you. The distribution bars under each metric are also worth reading: a page where 70% of visits are good and 20% are poor has a different problem from one where everything sits just above the threshold.
Lab data: a controlled test
Lab data comes from one Lighthouse run on Google’s servers. For the mobile tab it simulates a mid-range phone on a slow network; for desktop, a faster connection. The run loads the page once, without your visitors’ caches, cookies or interactions, and records what happened.
That makes lab data excellent for debugging and poor for judging. It is repeatable enough to compare before and after a change, and its opportunities point to specific causes: large images, render-blocking scripts, unused JavaScript, slow server response. But it is one visit under one set of conditions. It cannot see consent banners that appear only in some countries, personalised content, or how fast the page reacts to real taps.
Because lab tests have no user input, they use Total Blocking Time as a stand-in for responsiveness. A high TBT often goes together with poor INP, but the two are different measurements.
Why the two often disagree
Disagreement between lab and field is normal. The table shows the most common reasons.
| Situation | Likely explanation | What to trust |
|---|---|---|
| Lab score low, field passes | Real visitors have faster devices or warm caches than the simulated phone | Field data; use lab to find cheap wins |
| Lab score high, field fails | Problems appear only for some users, regions or after interaction | Field data; reproduce the conditions to debug |
| Field passes on desktop, fails on mobile | Mobile devices and networks are slower | Mobile field data, since most visits are often mobile |
| No URL field data, only origin | The page has too little Chrome traffic | Origin data as a rough guide, lab data for the page |
| Score changes between runs | Network and server variation in the lab | The median of several runs, not a single one |
The performance score itself is a weighted combination of lab metrics. It is a useful summary for developers, but Google’s page experience signals use field data for Core Web Vitals, not the lab score. A page does not need a score of 100.
How to use field data well
- Look at the Core Web Vitals report in Search Console for the whole site. It groups URLs with similar problems, so you can fix a template instead of one page.
- Prioritise failing metrics, not low scores. If only LCP fails, focus there; a guide like fixing a slow LCP gives the steps.
- Check mobile first. Most sites fail on mobile before desktop.
- Wait for the window. After a fix, give the 28-day data time to update before concluding anything.
- Collect your own field data if you can. A small real-user monitoring script shows which pages, countries and devices are slow, with less delay than CrUX.
How to use lab data well
- Run several tests and compare the median rather than reacting to one run.
- Read the opportunities and diagnostics, not just the score. They tell you what to change: image sizes, unused code, render-blocking resources, third-party scripts, server response time.
- Test templates, not every URL. One product page, one category page, one article and the home page usually cover most problems.
- Test before and after a deployment, on a staging copy if possible, to catch regressions before real users meet them.
- Use the “View treemap” and filmstrip to see which scripts are heavy and when the main content appears.
Common misreadings
- “The score is red, so we will lose rankings.” Page experience is one signal among many, and it is based on field data. Relevance and content quality matter far more.
- “We got 100 on desktop, so speed is fine.” Desktop is easier. Check mobile field data.
- “The tool is broken, the site feels fast.” It feels fast on your office connection and your new phone, with the site in cache. Many visitors have neither.
- “We fixed it yesterday, why is field data still failing?” The 28-day window has not caught up yet.
- “Every opportunity must be fixed.” Some savings are tiny. Start with the ones that affect the failing metric.
Speed checks on every page, not just the home page
PageSpeed Insights tests one URL at a time, which makes it easy to miss slow templates deeper in the site. Site SEO AI Audit includes a Speed and Core Web Vitals area that uses Google PageSpeed, LCP and CLS, and checks server response, compression and page weight on every crawled page, then weighs each issue by how many pages it affects. The free audit covers up to 200 pages, and larger sites get a preliminary report of the first 200 with the option of a full audit.
Related reading
- Interaction to Next Paint: how to find and fix delays
- How to fix Cumulative Layout Shift
- Server response time and TTFB
The bottom line
Field data tells you how real visitors experience a page and decides whether it passes Core Web Vitals. Lab data is a single controlled test that explains why a page is slow and helps you verify fixes. Judge with field data, debug with lab data, focus on the metrics that fail rather than the score, and give field data four weeks to reflect a change.
FAQ
Does Google use the PageSpeed Insights score for rankings?
No. The 0–100 performance score is a lab summary for developers. Google’s page experience signals use field data on Core Web Vitals, which comes from real Chrome users, and page experience is only one of many ranking signals.
Why is there no field data for my page?
The page does not have enough Chrome visits in the last 28 days to be included in the Chrome User Experience Report. PageSpeed Insights then shows origin-level data for the whole site if available, or no field data at all.
Why does my score change every time I test?
Lab tests vary with network conditions, server load and third-party scripts. Run several tests and compare the median. Small changes of a few points between runs are normal and not meaningful.
How long does it take for field data to show a fix?
Field data covers a rolling 28-day period, so a fix shows up gradually and fully after about four weeks. Lab data shows the effect immediately, which is why it is useful for checking a change.
Should I optimise for mobile or desktop first?
Mobile, in most cases. Mobile devices and networks are slower, Google uses mobile-first indexing, and many sites pass on desktop while failing on mobile. Check the mobile tab and the mobile Core Web Vitals report first.