ENEnglish
 LTLietuviškai
 DEDeutsch
 FRFrançais
 RUРусский
 ESEspañol
 PLPolski
 ITItaliano
 UKУкраїнська
 CSČeština
 PTPortuguês
 JA日本語
JA日本語 LVLatviešu valoda
 ETEesti
 HUMagyar
 IDBahasa Indonesia
 TRTürkçe
 HIहिन्दी
 ELΕλληνικά
 ARالعربية
 THไทย
THไทย VITiếng Việt
 RORomână
 MSBahasa Melayu
 BNবাংলা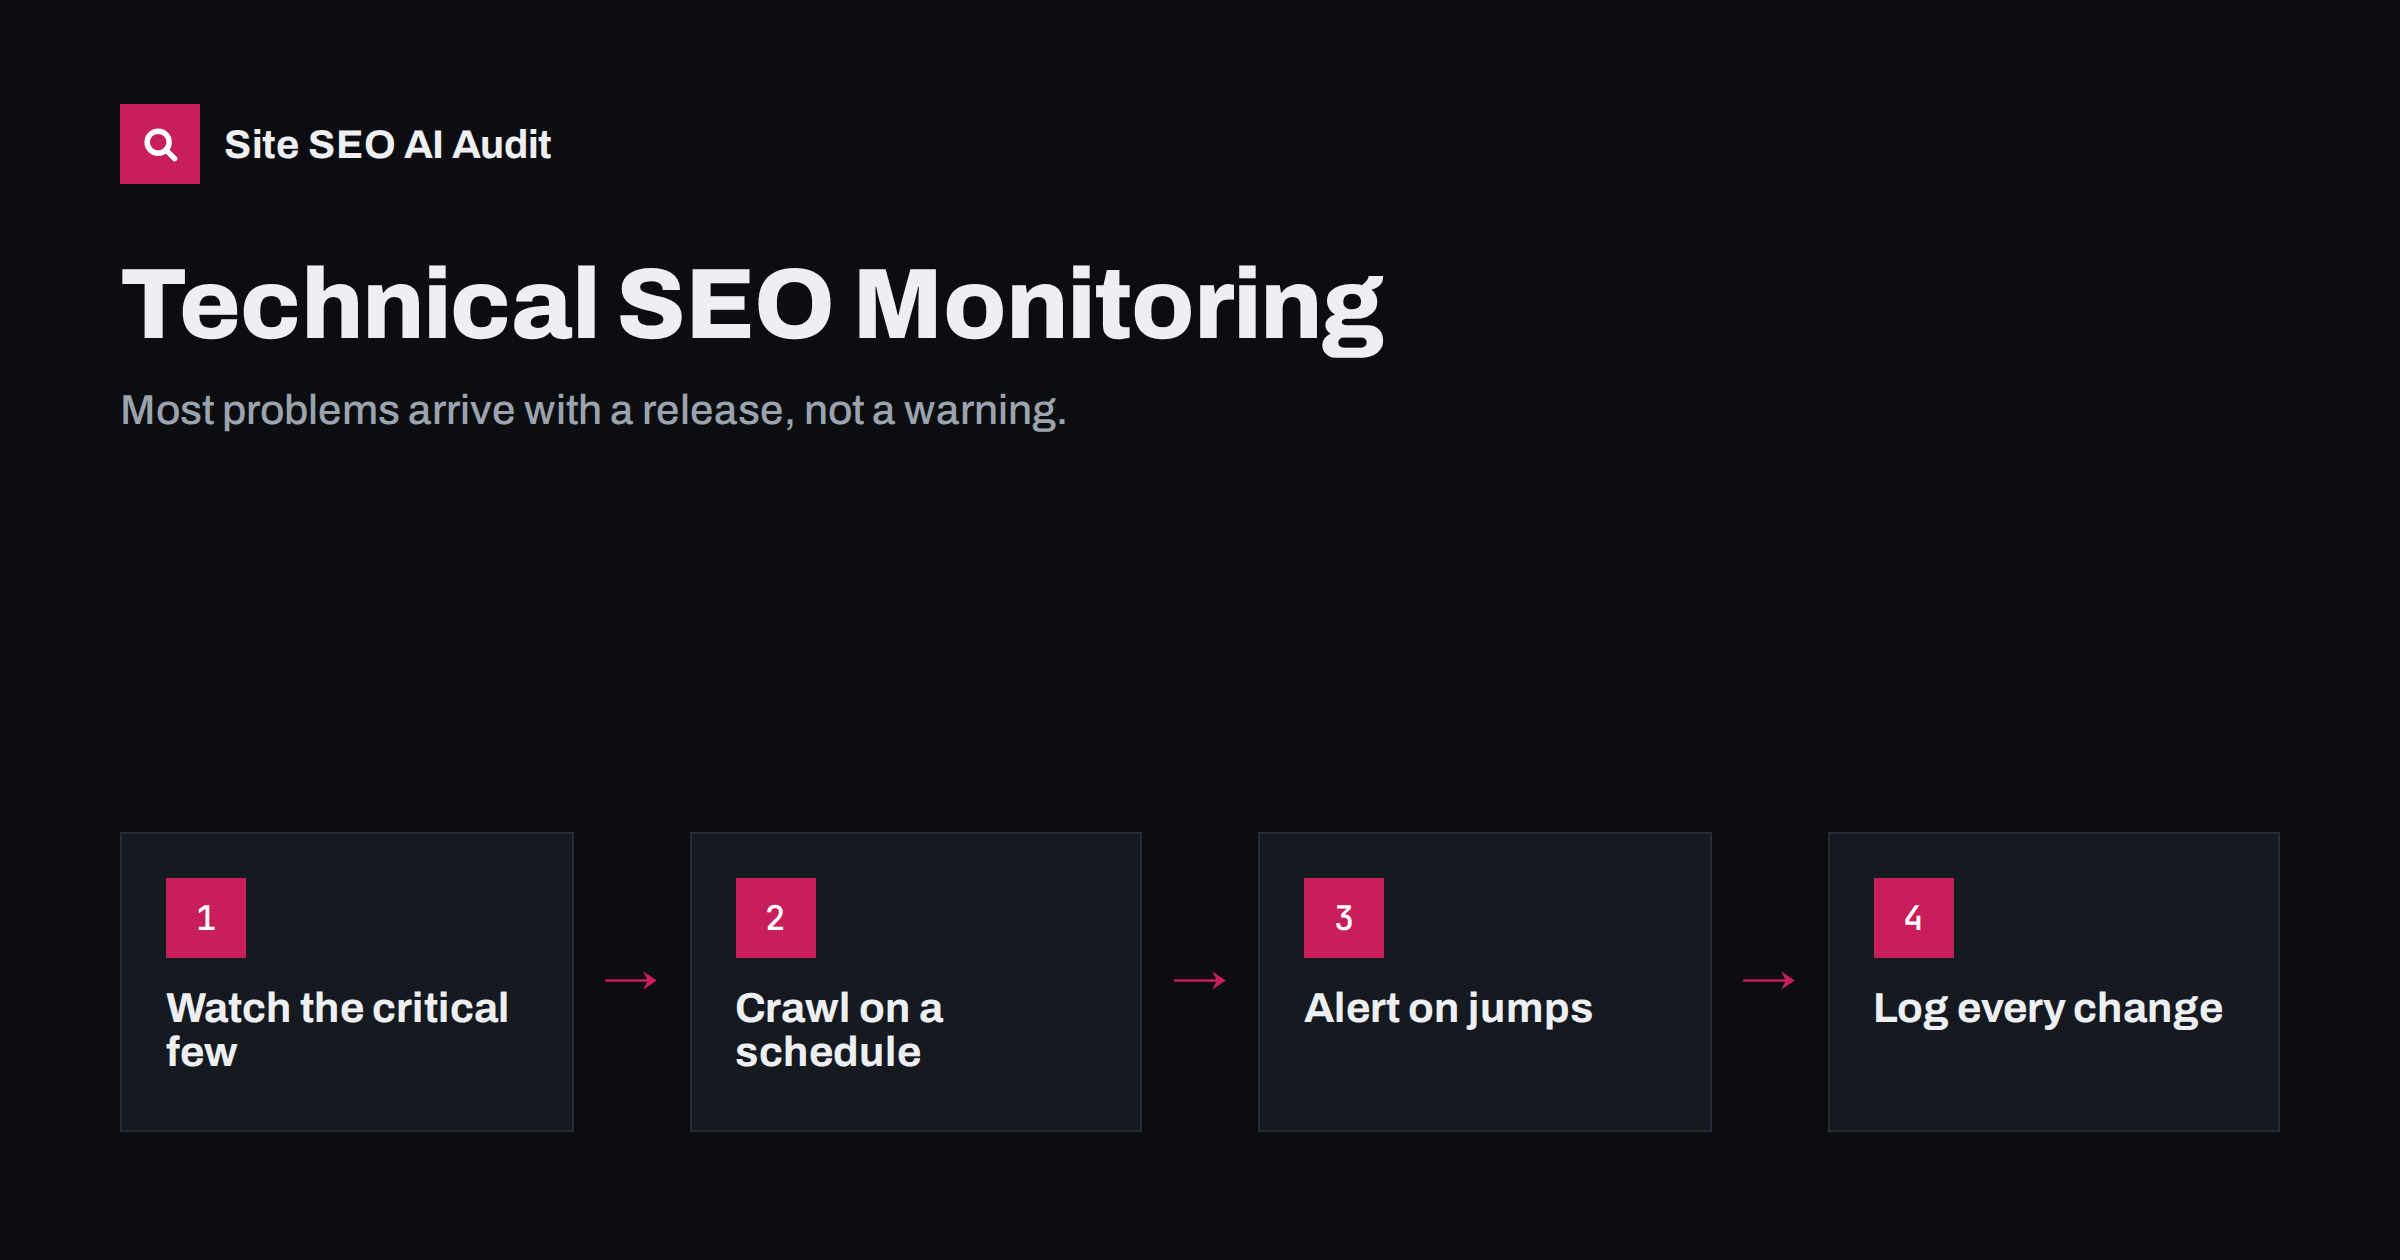
Short answer: technical SEO monitoring means checking the same key signals regularly so you notice regressions within days instead of months. Watch robots.txt, noindex directives, status codes, canonicals, redirects, sitemaps, server response time and Core Web Vitals, using scheduled crawls, Search Console and simple alerts. Compare each crawl with the previous one, react to sudden changes, and keep a log of site changes so you can connect effects to causes.
Why monitoring matters more than one-off audits
A one-off audit shows the state of a site on one day. Most technical SEO damage, however, happens later: a plugin update adds noindex to a post type, a developer deploys staging’s robots.txt, a CDN rule starts blocking crawlers, a theme update removes canonical tags, or a product import creates thousands of duplicate URLs. None of these announce themselves. Traffic simply starts to slide days or weeks later, as search engines recrawl the affected pages.
By the time a drop shows up in traffic reports, the cause may be weeks old and buried among other changes. Monitoring shortens that gap from weeks to days, which often turns a serious incident into a minor one.
Monitoring also changes how teams work. When everyone knows that robots.txt, noindex and key page status are checked after each release, fewer risky changes slip through in the first place, and when something does break, the discussion is about a specific change on a specific date rather than a vague sense that “rankings dropped”. It turns technical SEO from occasional firefighting into routine maintenance, much like backups and security updates.
The critical signals to watch
Not everything needs daily attention. A small set of signals catches most serious regressions:
| Signal | What a regression looks like | How often |
|---|---|---|
| robots.txt | New Disallow rules, especially Disallow: / |
Daily or on every deploy |
| noindex (meta and header) | Noindex on templates that should be indexed | Daily or on every deploy |
| Status codes of key pages | Home, categories, top pages returning errors or redirects | Daily |
| Canonicals | Missing, pointing elsewhere, pointing to redirects | Weekly crawl |
| Redirects | New chains or loops, broken redirect targets | Weekly crawl |
| সাইটম্যাপ | Fetch errors, sudden change in URL count, errors inside | Weekly |
| Server response time and 5xx | Rising response time, error spikes | Continuously or daily |
| Core Web Vitals | Templates moving from good to poor | Monthly (field data is a 28-day window) |
| Indexed pages | Sudden fall or unexplained rise | Weekly |
Tools for each layer
- Uptime and key page checks. A simple uptime monitor that also checks the status code and a text snippet on your most important pages catches outages and accidental changes quickly.
- Scheduled crawls. A weekly or monthly crawl of the whole site, compared with the previous one, reveals changes in titles, canonicals, noindex, status codes, links and structured data across all pages.
- Google Search Console. The page indexing report, crawl stats, Core Web Vitals and sitemap reports show how Google experiences the site. E-mail notifications for critical issues should be enabled for at least one person.
- Server logs and error monitoring. Rising 5xx errors or timeouts are visible there before they affect crawling statistics.
- Deploy checks. A short automated test after each deployment that fetches robots.txt and a few key pages and checks for noindex and correct status codes.
Compare crawls, not just scores
The most useful thing a scheduled crawl gives you is a comparison. Look at what changed since last time:
- pages that disappeared or newly appeared;
- pages whose status changed from 200 to something else;
- pages that gained noindex or lost their canonical;
- new duplicate titles or descriptions;
- new redirect chains or broken links;
- changes in click depth for important pages;
- structured data that disappeared from a template.
An overall score is useful as a trend, but a stable score can hide one very important page breaking while many small things improve. The changed-pages view catches that.
Keep a change log
Monitoring tells you something changed; a change log tells you why. Keep a simple record with dates of:
- theme and plugin updates;
- deployments and configuration changes;
- CDN, firewall and hosting changes;
- content imports, bulk edits and URL changes;
- SEO setting changes in the CMS.
Annotating these in your analytics tool and checking them first when a metric moves saves hours of guessing.
Regressions monitoring typically catches
These are the kinds of problems that regular checks find again and again, usually within days of the change that caused them:
- A theme or SEO plugin update that changes default settings, for example switching a post type or taxonomy to noindex, or dropping canonical tags from archives.
- A deployment that copies staging configuration, such as a restrictive robots.txt or a noindex header.
- A new security rule or CDN setting that returns 403 or challenge pages to crawlers.
- A product or content import that creates thousands of near-duplicate pages, empty categories or broken image links.
- A navigation redesign that removes links to whole sections, turning pages into orphans or pushing them deeper.
- A slow plugin or database growth that gradually raises server response time until crawling slows down.
- An expired certificate or a DNS change that makes the site unreachable for some visitors and crawlers.
Every one of these is easy to fix when found early and expensive when found after traffic has dropped for a month.
Setting sensible alert thresholds
Alerts that fire too often get ignored; alerts that never fire are useless. Some practical thresholds:
- Any change to robots.txt: always notify, because changes are rare and important.
- Noindex on a key page: immediate alert, no threshold.
- Key page status not 200: alert after two consecutive failed checks, to avoid noise from brief network hiccups.
- Error pages in a crawl: alert when the number grows by more than a set share compared with the previous crawl, rather than on any single new 404.
- Server response time: alert when the average over an hour rises well above its normal level for your site.
- Indexed pages: review when the weekly count falls noticeably, and investigate before assuming it is normal fluctuation.
Route alerts to a person who can act on them, not only to a shared inbox, and make sure someone covers holidays. An alert that arrives while nobody is responsible for it is the same as no alert. Start conservative, then tighten or loosen thresholds based on what actually proved useful in the first months.
What to do when an alert fires
- Confirm on the live site. Fetch the URL yourself with
curl -sIand view the source. Tools occasionally report false alarms, for example from a temporary network issue. - Estimate the scope. One page, one template or the whole site?
- Check the change log for anything deployed around the time the problem started.
- Fix or roll back the cause. For site-wide blocks such as noindex or robots.txt, act immediately.
- Help recovery. Resubmit the sitemap and request indexing for the most important affected pages.
- Add a check that would have caught it earlier, so the same regression cannot slip through twice.
A realistic routine for small teams
Not every business has a technical SEO team. A routine that fits a small business or an agency managing several sites:
- Daily (automated): uptime and key page checks with alerts.
- After every update or deployment (5 minutes): robots.txt, noindex and status on home and two key templates.
- Weekly (automated): site crawl with comparison and e-mail summary.
- Monthly (30 minutes): review Search Console reports, Core Web Vitals and the crawl comparison; decide on fixes.
- Quarterly: a full audit with prioritised fix list.
How Site SEO AI Audit supports monitoring
Site SEO AI Audit crawls your whole site like a search engine and scores it across seven areas. On paid plans you can re-audit after fixes; the Pro plan adds weekly audits with e-mail alerts and lets you compare audits over time, and the Agency plan adds white-label PDF reports for clients. Because every issue is weighted by the share of pages it affects, a regression on a template shows up as a clear drop in the relevant area score. See plan details.
Related reading
- Technical SEO audit checklist: 40 checks in the right order
- Search Console page indexing report: every status explained
- Staging site indexed by Google? How to fix and prevent it
- X-Robots-Tag: how to control indexing with HTTP headers
The bottom line
Technical SEO breaks quietly, usually right after a change. Monitor the few signals that matter most, crawl on a schedule and compare with the last crawl, alert on sudden jumps, keep a change log, and act quickly when something critical moves. Monitoring is cheaper than recovery.
FAQ
How often should I crawl my site?
Weekly is a good default for active sites and shops; monthly is enough for small, stable sites. Always crawl after redesigns, migrations and major plugin or theme updates.
What is the most important thing to monitor?
Whether your important pages are indexable: robots.txt, noindex directives and status codes on key templates. These can remove large parts of a site from search in one change.
Does Search Console alert me to problems?
It sends e-mails for some new issues, such as a spike in indexing errors, but with delays. It is a useful safety net, not a replacement for your own checks after changes.
Can technical SEO monitoring be automated?
Largely, yes. Uptime checks, deploy tests, scheduled crawls and alerts can run automatically. Deciding what to fix and in which order still needs a person.
Why did my traffic drop weeks after a change?
Search engines recrawl pages gradually, so the effect of a change such as an accidental noindex spreads over days or weeks. Monitoring the signals directly catches it before the traffic effect becomes visible.